 Bitcoin Yearly Lows
Zoom in with touchscreen: Touch and hold with ONE finger then drag.
Zoom in on desktop: Left click and drag.
Reset: Double click.
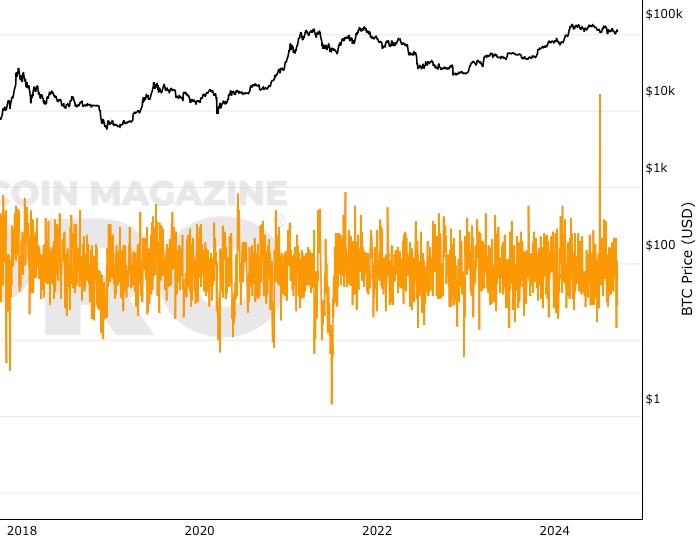
When most people follow the Bitcoin price, they focus on the all-time highs (ATHs). But a better way to understand Bitcoin’s long-term growth is by looking at the yearly low prices.
This chart tracks the annual low for Bitcoin every year since 2012, updating automatically as new data comes in. By focusing on the lowest points of each year, investors can see how even during bear markets, Bitcoin’s long-term adoption has consistently pushed its “floor price” higher over time.
Why Yearly Lows Matter
- Resilience through cycles: Even after major market corrections, Bitcoin rarely returns to its previous yearly low.
- Signal of adoption: Rising yearly lows highlight how Bitcoin’s global demand and adoption increase year after year.
- Smarter perspective: Instead of chasing tops, tracking Bitcoin price lows gives a more realistic view of long-term support and value growth.
Historical Bitcoin Price Lows
- 2012: $4
- 2013: $13
- 2015: $190
- 2018: $3,237
- 2020: $5,014
- 2021: $28,723
…and the trend continues upward as Bitcoin gains mainstream recognition.
Bitcoin Price in Perspective
Bitcoin remains volatile in the short term, but the historical yearly low trend shows why many see it as a reliable long-term store of value. As institutional investors, corporations, and individuals adopt Bitcoin, these yearly lows provide one of the clearest measures of its growing strength.
Stay tuned to this live chart to track the Bitcoin price lows as they evolve — a powerful reminder that Bitcoin’s story is not just about peaks, but about steadily rising foundations.
You May Also Be Interested In

Whale Shadows (aka Revived Supply)
Onchain tracking of old coins moving again in large amounts.

Bitcoin Lightning Nodes
Total number of Bitcoin Lightning nodes.
Blocks Mined
Number of blocks mined per day.
Make smarter decisions about Bitcoin. Instantly.
Access the Bitcoin and Global Macro Charts that really drive Bitcoin’s price.
+40 chart alerts. Never miss critical levels on charts again.
Analysis newsletter. Manage your emotions at market extremes.
Private Tradingview indicators. See Bitcoin chart levels in real time!
Cancel anytime.
Any information on this site is not to be considered as financial advice. Please review the Disclaimer section for more information.