 Bitcoin Price Yearly Highs
Zoom in with touchscreen: Touch and hold with ONE finger then drag.
Zoom in on desktop: Left click and drag.
Reset: Double click.
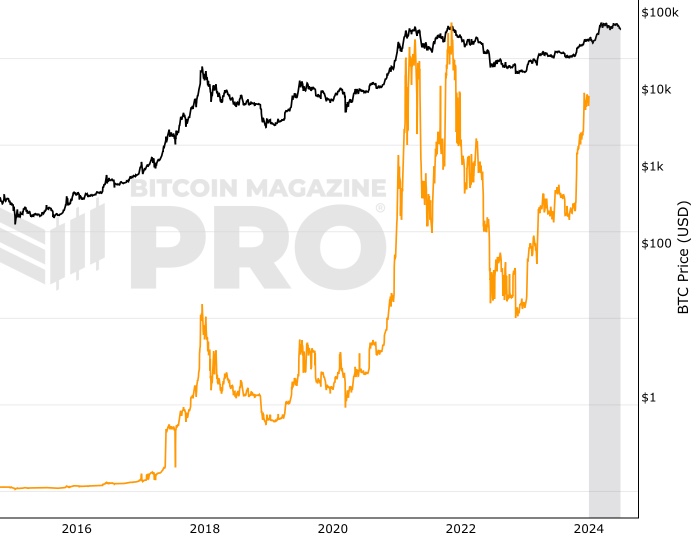
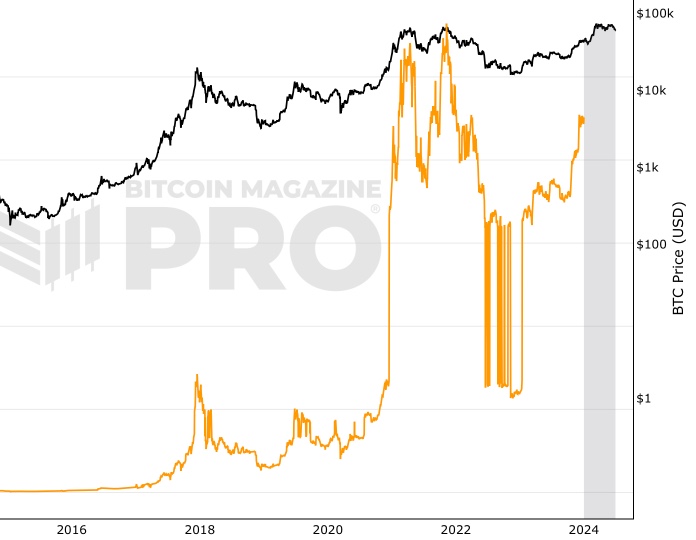
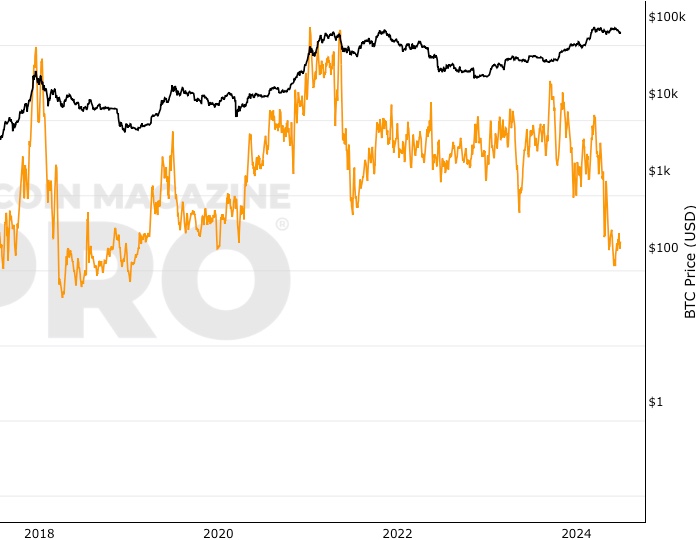
This chart shows the highest daily close for Bitcoin (BTC/USD) in each year, updated live as new data comes in. While short-term volatility grabs headlines, looking at the yearly highs gives a clear picture of Bitcoin’s explosive long-term growth and adoption.
Why Track Bitcoin Yearly Highs?
- All-time highs in context: Instead of focusing only on one peak, yearly highs show how Bitcoin regularly sets new records.
- Historical perspective: From single-digit prices in its early years to tens of thousands of dollars today, Bitcoin’s yearly highs highlight its journey from niche asset to global financial force.
- Investor insights: Watching the highest Bitcoin prices per year helps identify cycles of growth, consolidation, and renewed adoption.
Historical Bitcoin Yearly Highs
Some key yearly highs in Bitcoin’s history include:
- 2013: $1,147 — the first big bull run.
- 2017: $19,497 — Bitcoin enters mainstream headlines.
- 2021: $68,789 — the peak of a major adoption cycle.
Each new high demonstrates how Bitcoin has continued to outperform traditional assets over the long run.
Bitcoin Price in Perspective
The Bitcoin yearly high chart makes it easy to compare past bull markets with today’s trends. It also shows that while Bitcoin can experience deep pullbacks, its record highs keep pushing upward over time.
For traders, investors, and researchers, this chart provides a live snapshot of Bitcoin’s growth story, one peak at a time.
You May Also Be Interested In
Addresses with Balance > $100k
Live chart showing the number of unique addresses holding at least $100k.
Addresses with Balance > $1m
Live chart showing the number of unique addresses holding at least $1m.
Bitcoin Active Addresses
The number of Bitcoin Active Addresses.
Make smarter decisions about Bitcoin. Instantly.
Access the Bitcoin and Global Macro Charts that really drive Bitcoin’s price.
+40 chart alerts. Never miss critical levels on charts again.
Analysis newsletter. Manage your emotions at market extremes.
Private Tradingview indicators. See Bitcoin chart levels in real time!
Cancel anytime.
Any information on this site is not to be considered as financial advice. Please review the Disclaimer section for more information.