You Don't Need A Complex Strategy. You Just Need A Plan.
April 3, 2026
Author: Matt - Director of Research & Analytics
One of the most common things I see in this space is people overcomplicating their approach to Bitcoin accumulation. Waiting for obscure signals, layering indicator on top of indicator, convincing themselves that unless they have the perfect setup, they shouldn't be doing anything at all. This week, I want to show you that the opposite approach, simple, consistent, data-anchored, has historically blown almost everything else out of the water.
We're going to look at what blind dollar-cost averaging has actually returned over the past eight-plus years, then test whether two of the most basic and widely available metrics in the space can meaningfully improve on that. No overfitting, no exotic tools, no complicated logic. Just a plan, executed consistently.
This week at a glance:
- Blind DCA into Bitcoin over the past eight years has outperformed gold, Apple, and the Dow Jones by a significant margin.
- A simple Fear & Greed Index strategy, buying at extreme fear, selling at extreme greed, returned over 1,100%, nearly doubling blind DCA.
- Accumulating Bitcoin when the MVRV sits in its bottom 15th percentile has provided an 8.5x return per dollar invested.
- Combining both metrics improved returns further still, to over 1,400%, including fees and slippage.
- You don't need to make this complicated; a basic plan built around data, executed without emotion, does the heavy lifting.
The Baseline
Let's start with the simplest possible approach. No signals, no indicators, just buying Bitcoin consistently, week after week, regardless of price or sentiment. Going back eight years, starting from a point when Bitcoin had already entered the global stage and was well past being an obscure niche asset, blind weekly Dollar-Cost Averaging (DCA) has returned 325% on the total capital deployed. That already puts it comfortably ahead of gold, Apple stock, and the Dow Jones Industrial Average over the same period, assets that have individually had strong runs in their own right.
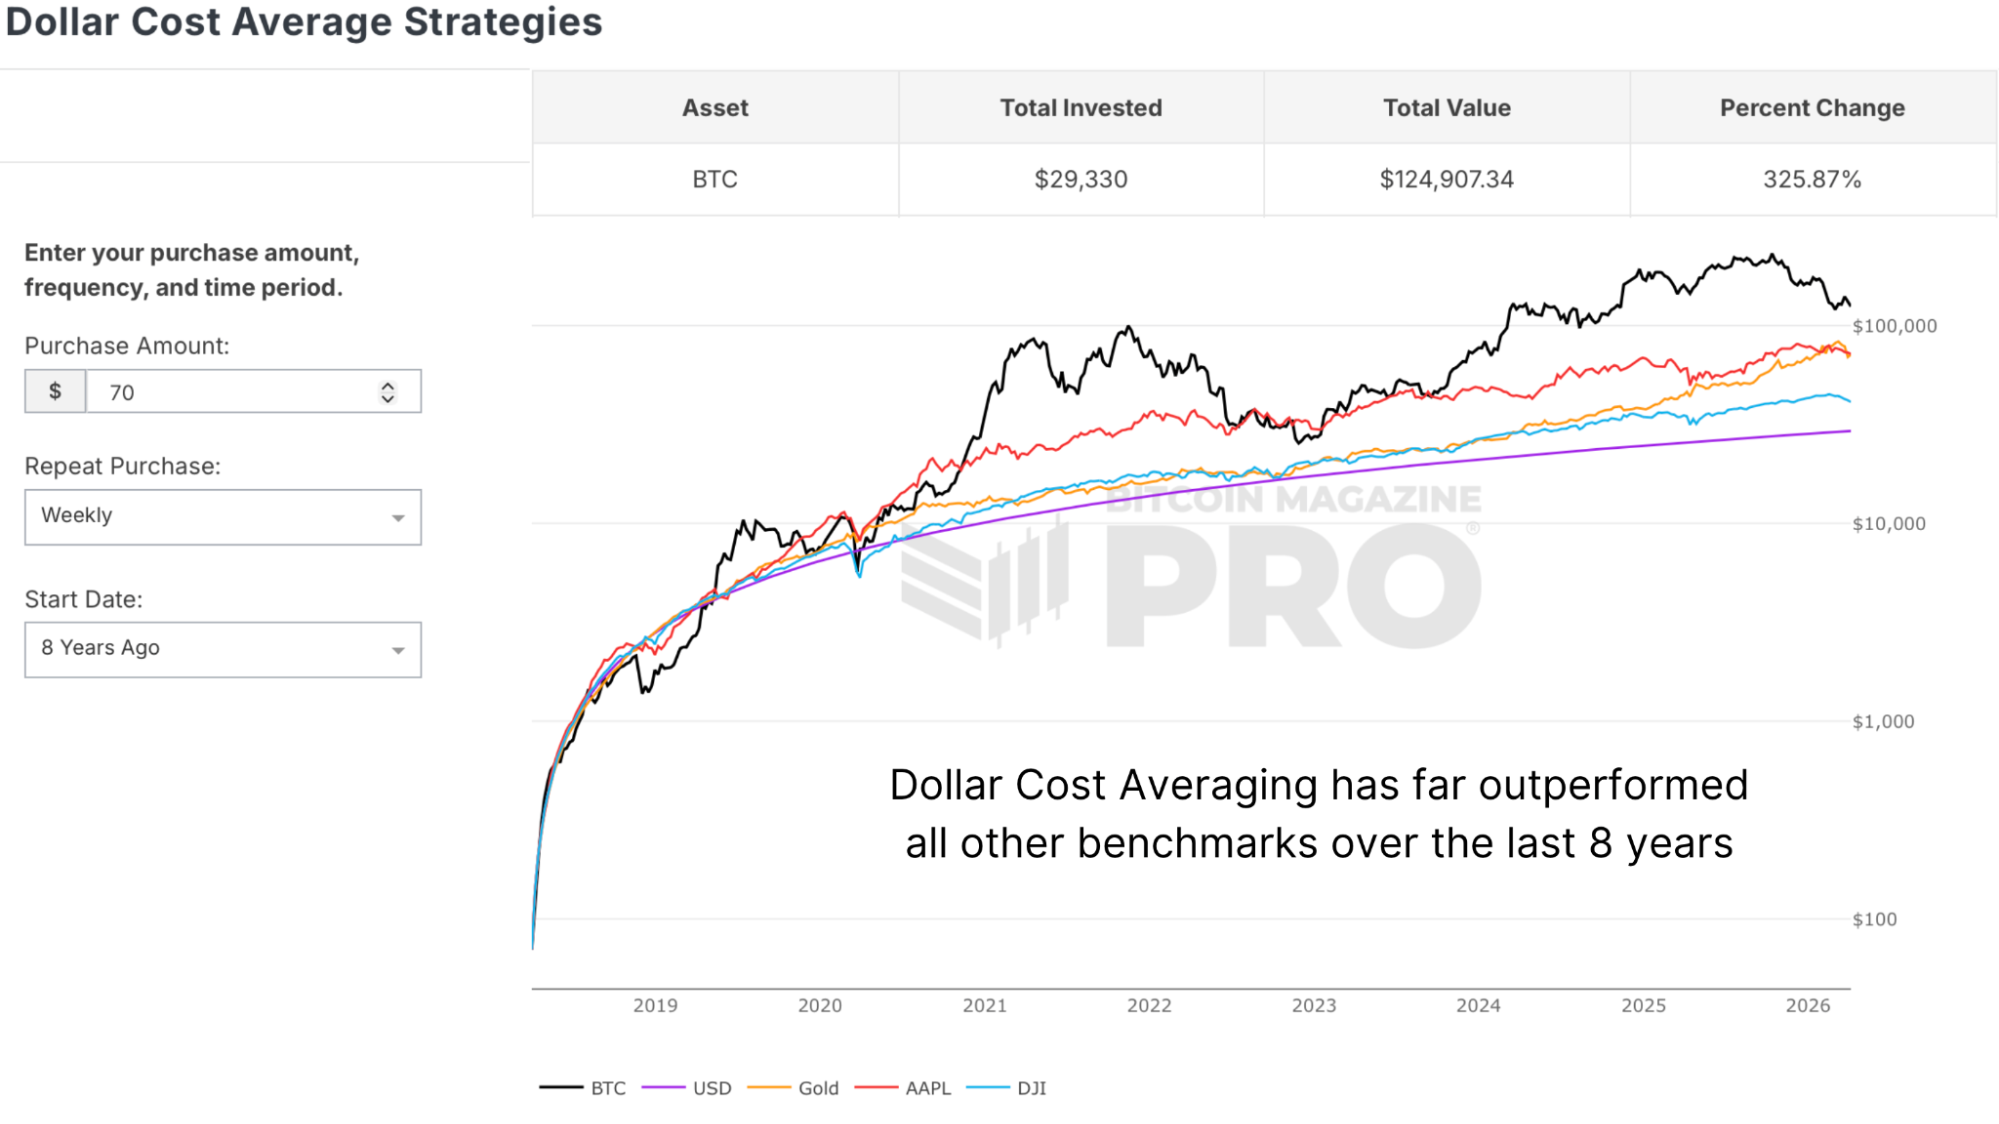
Figure 1: Over 8 years, a simple Bitcoin Dollar-Cost Averaging Strategy has outperformed other assets.
Improving On That
If we consider DCA as our baseline, how can we improve on this without making it complicated? The Bitcoin Fear And Greed Index is about as accessible as it gets. A 0 to 100 scale tracking Bitcoin market sentiment through price volatility, social media trends, market dominance, and a handful of other inputs. It's free, it's widely available, and it's been around long enough to backtest meaningfully.
The strategy here is about as simple as it sounds. We accumulate when the index reads 20 or below, deeper into extreme fear than the standard 25 threshold, adjusted slightly based on how Bitcoin's sentiment data actually distributes, and we scale out when it reaches 80 or above. No intraday timing. No position sizing complexity. Just 1% in when it's fearful, and prices are typically lower, and 1% out when it's greedy and prices are often highest.

Figure 2: Using the Bitcoin Fear And Greed Index to enhance trading strategy.
Applied from the close to the same starting point eight years ago (as far back as the Fear & Greed data exists), including commissions and slippage, this approach returned over 1,100%, significantly outperforming blind DCA. Also, compare that to the 657% you'd have made by simply going all-in as a lump sum on that same date, and the improvement is substantial.
Maximising Accumulation
Some people aren't focused on USD returns at all. Their goal is simply to accumulate as much bitcoin as possible, which is a perfectly reasonable thesis if your time horizon is long enough and you believe in the underlying asset. For that approach, the MVRV Ratio is a more relevant tool than the Fear & Greed Index.
The MVRV, Market Value to Realized Value, is the ratio of Bitcoin's current price to the average cost basis of every coin in circulation. Rather than applying a fixed threshold, which risks becoming outdated as Bitcoin's market matures and its ratio naturally compresses over successive cycles, the approach here uses a percentile distribution. Specifically, accumulating only when the MVRV falls into its bottom 15th percentile of historical daily readings.
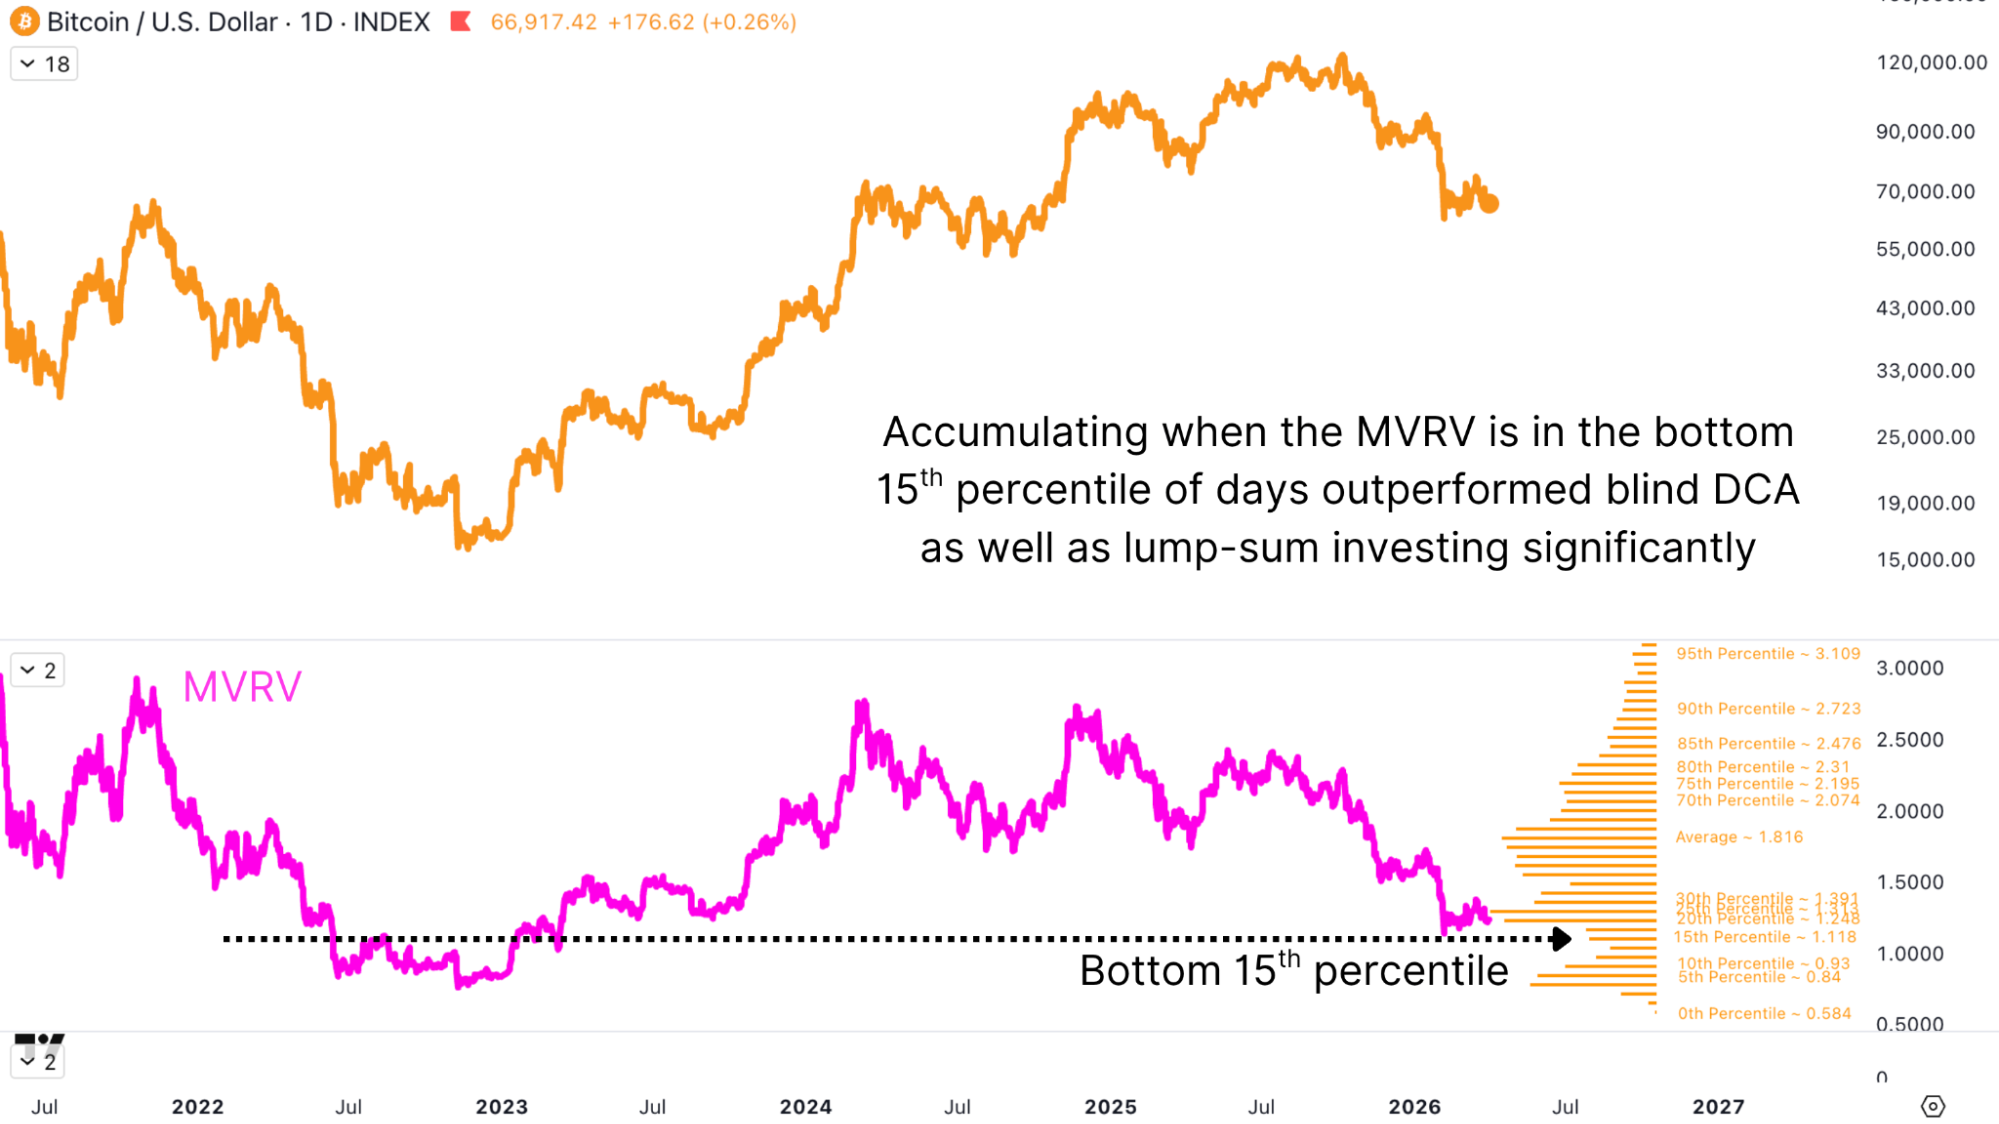
Figure 3: Using the MVRV Ratio’s percentile distribution to trigger accumulation points.
At current levels, the MVRV hasn't quite reached that accumulation threshold yet. The 15th percentile sits around 1.118 on the ratio, which would correspond to a bitcoin price somewhat below current levels. But the framework is worth understanding now, because it's precisely the kind of level that tends to emerge during extended drawdowns.
The key dynamic is straightforward: you're not buying every day. You're holding capital in reserve and deploying it specifically when the market's own data says conditions are most favorable.
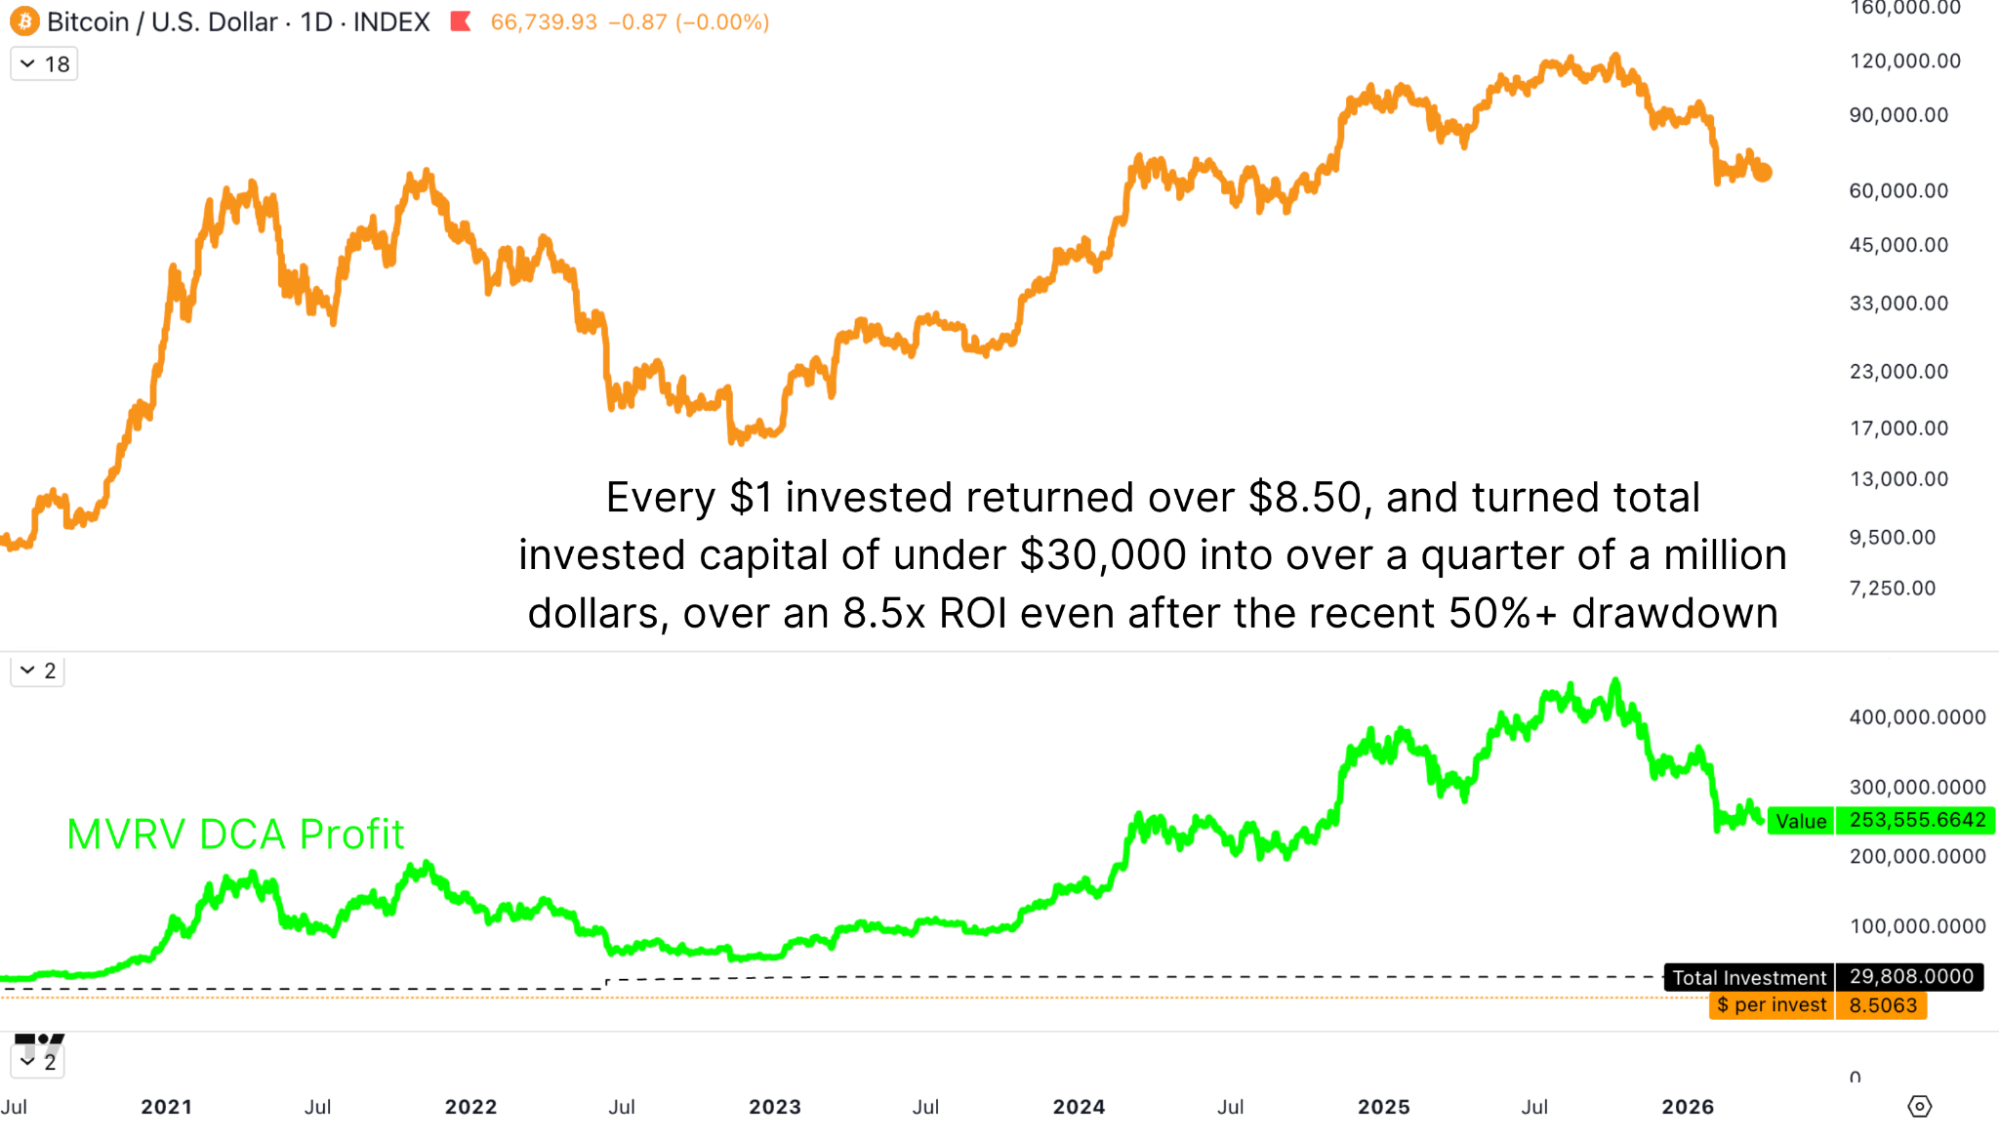
Figure 4: Profits returned from the MVRV-enhanced DCA strategy.
What does it deliver when applied consistently? Under $30,000 in total capital deployed turned into over a quarter of a million dollars, an 8.5x return per dollar invested. Even after the recent drawdown of more than 50% from the peak, and measured at current prices rather than the highs.
Confluence
One principle worth taking seriously in any data-driven approach is that no single indicator is infallible. Markets evolve. What's worked historically may work less cleanly in future cycles as more participants become aware of the signals and begin to price them in. The answer to that isn't to abandon simple indicators, it's to look for confluence between them.
So the final test: what happens when you use the Fear & Greed Index entries but only scale out when the MVRV is also in its top 15th percentile, adding that second layer of confirmation before reducing exposure? The result is a total return of over 1,400%, including all fees and slippage across 280 trades. That's more than double the lump-sum return from eight years ago, and roughly four times blind DCA, using two of the most freely available, most widely discussed metrics in the space.
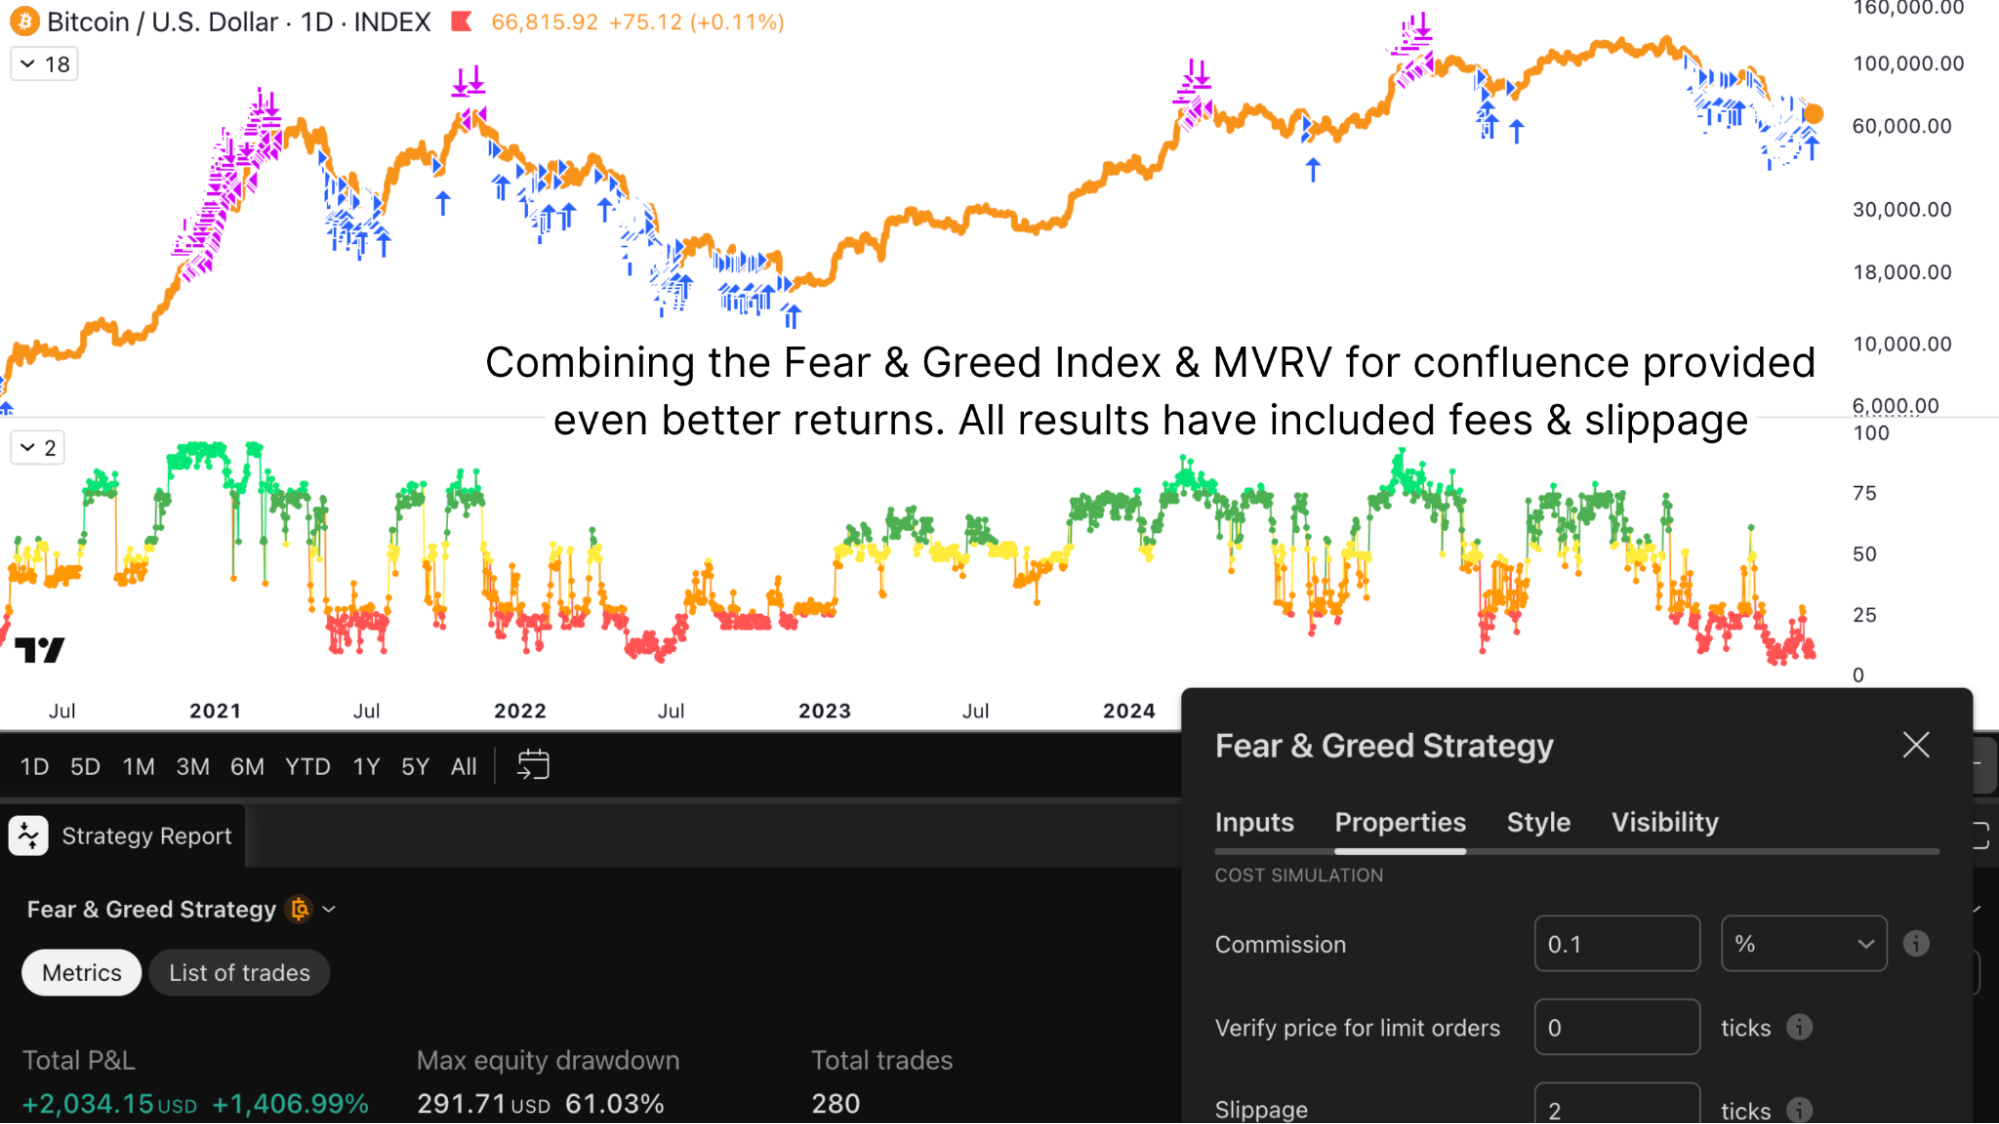
Figure 5: Using the confluence between two indicators further improves our strategy.
Closing Thoughts
The temptation in a market like this is to wait for certainty that never comes, the perfect level, the definitive signal, the moment when everything lines up cleanly enough to act without doubt. That moment doesn't exist. What does exist is a body of data pointing clearly toward accumulation zones, and a set of simple tools that have historically performed well when applied consistently and without emotion.
You don't need to watch every chart. You don't need to follow every metric. Set your parameters, set your alerts, and let the process do the work. A basic plan, executed with discipline, beats the majority of active approaches. The data backs it up, not because these indicators are magic, but because they take human emotion out of the equation at exactly the moments when emotion tends to be most expensive.
For a more in-depth look into this topic, watch our most recent YouTube video here:
I Use Just 1 Indicator And Outperform Bitcoin (Easily)
Matt Crosby
Director of Research & Analytics
Any information on this site is not to be considered as financial advice. Please review the Disclaimer section for more information.