Why Bitcoin Might Not Reach The Realized Price Again
July 10, 2026
Author: Matt - Director of Research & Analytics
The Realized Price is the classic Bitcoin data point, especially during a bear market. It represents the average accumulation price of all bitcoin on the network, and historically, every single bear market has bottomed beneath it. Buy below the realized price, the logic goes, and you've nailed the cycle low. Countless people are waiting to do exactly that right now. But what if there's a chance we never get there?
If you’re in a hurry:
- The Realized Price currently sits around $53,000.
- The MVRV ratio's peaks and troughs have been contracting at a consistent rate across Bitcoin's entire history, forming a clear wedge.
- A statistical line of best fit through the MVRV troughs has just crossed above 1.00, implying Bitcoin may not dip beneath its realized price this cycle.
- Only 0.29% of all days in Bitcoin's history have closed beneath this trendline.
- The Long-Term Holder Realized Price is on track to cross $50,000 within weeks, adding a second layer of support.
Waiting
The Realized Price is arguably the single most-watched level in on-chain analysis. When Bitcoin's market price dips beneath it, the average holder is at a loss; historically, that condition has marked genuine capitulation and some of the best accumulation windows the asset has ever offered.
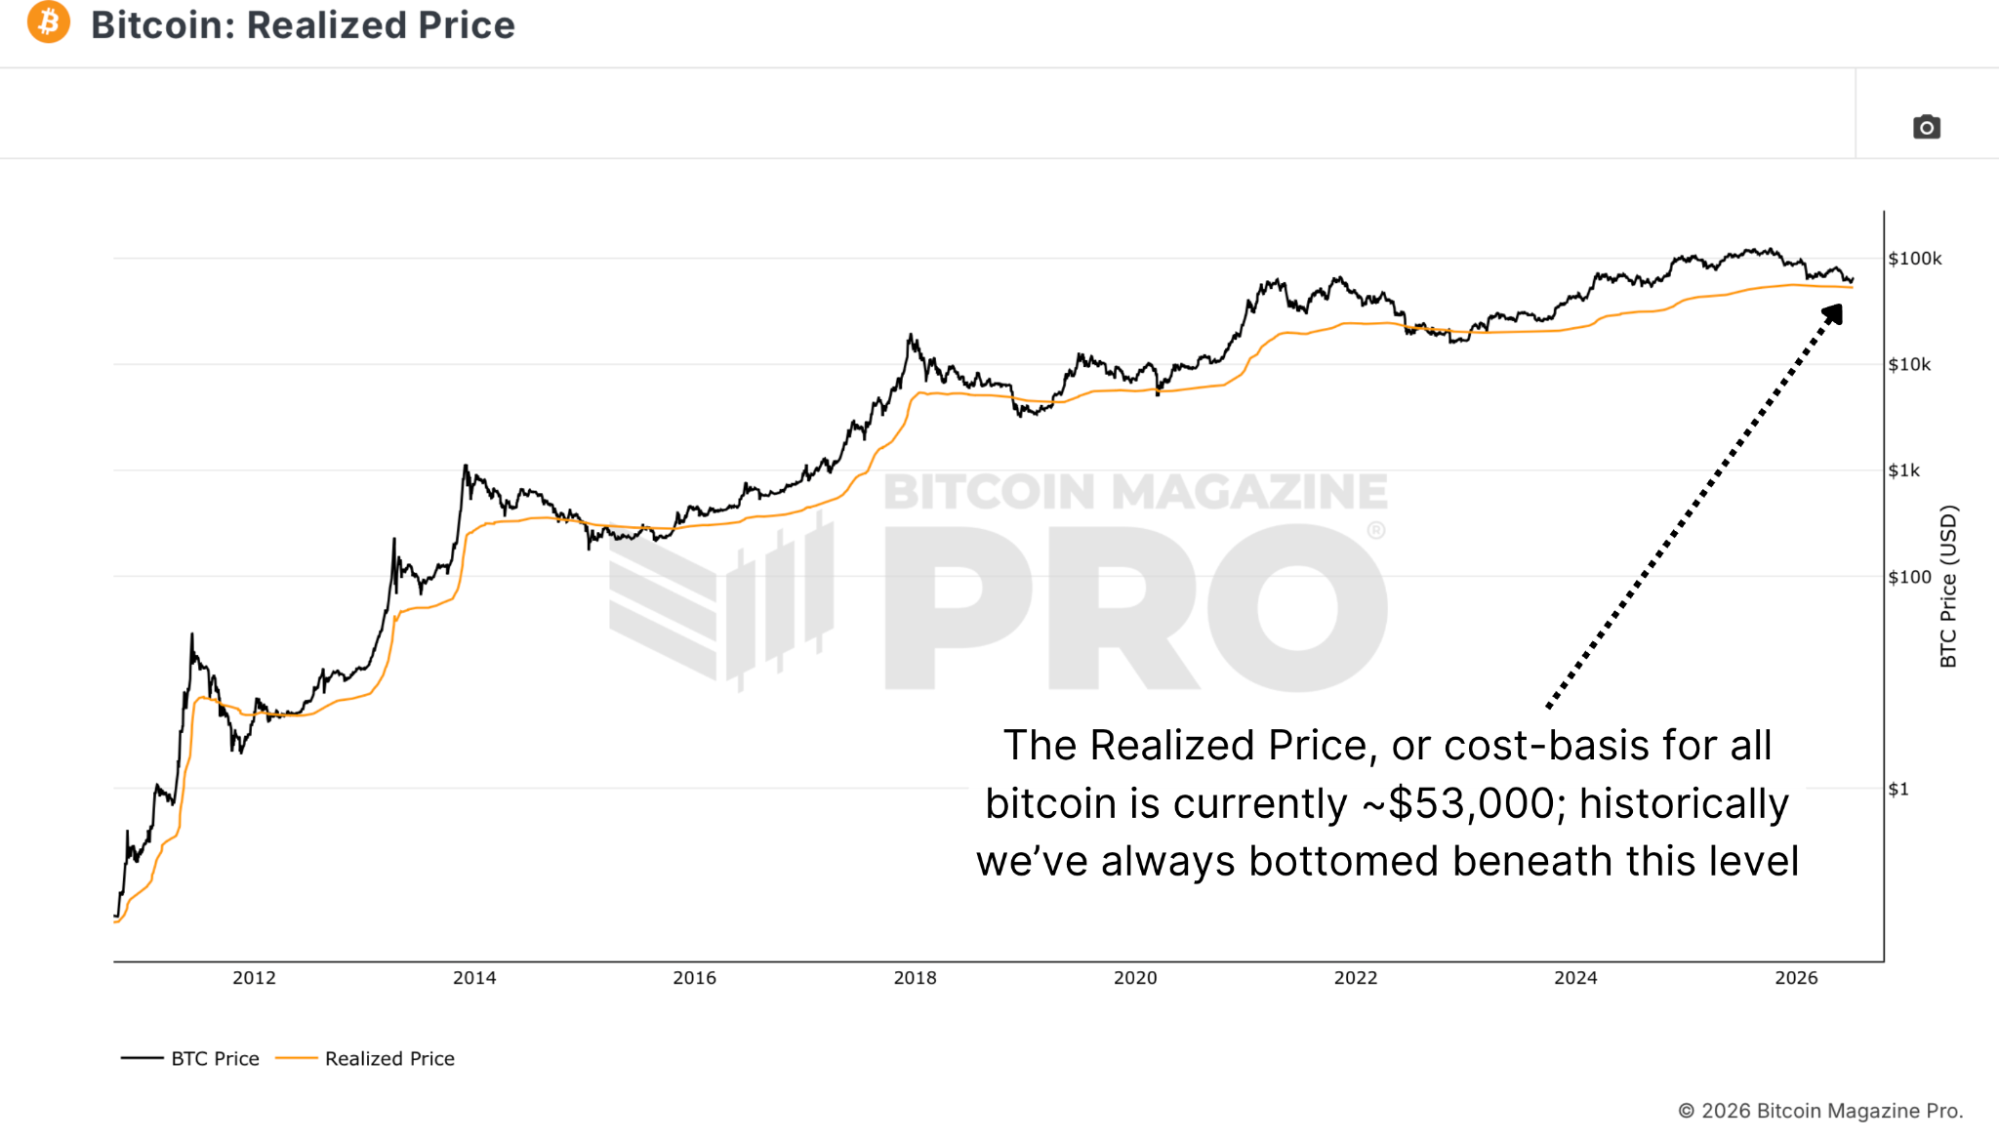
Figure 1: Bitcoin's cost basis, the Realized Price, currently sits around $53,000.
That reliability is exactly why so many people have anchored their entire accumulation plan to it this cycle. The problem is that anchoring to a level assumes the level behaves the way it always has.
Contraction
Look at the raw MVRV ratio, the simple relationship between price and realized price, across Bitcoin's full history, and a clear pattern emerges. The peaks are getting lower. The troughs are getting higher. Both sides are contracting toward the middle in a consistent wedge, cycle after cycle.
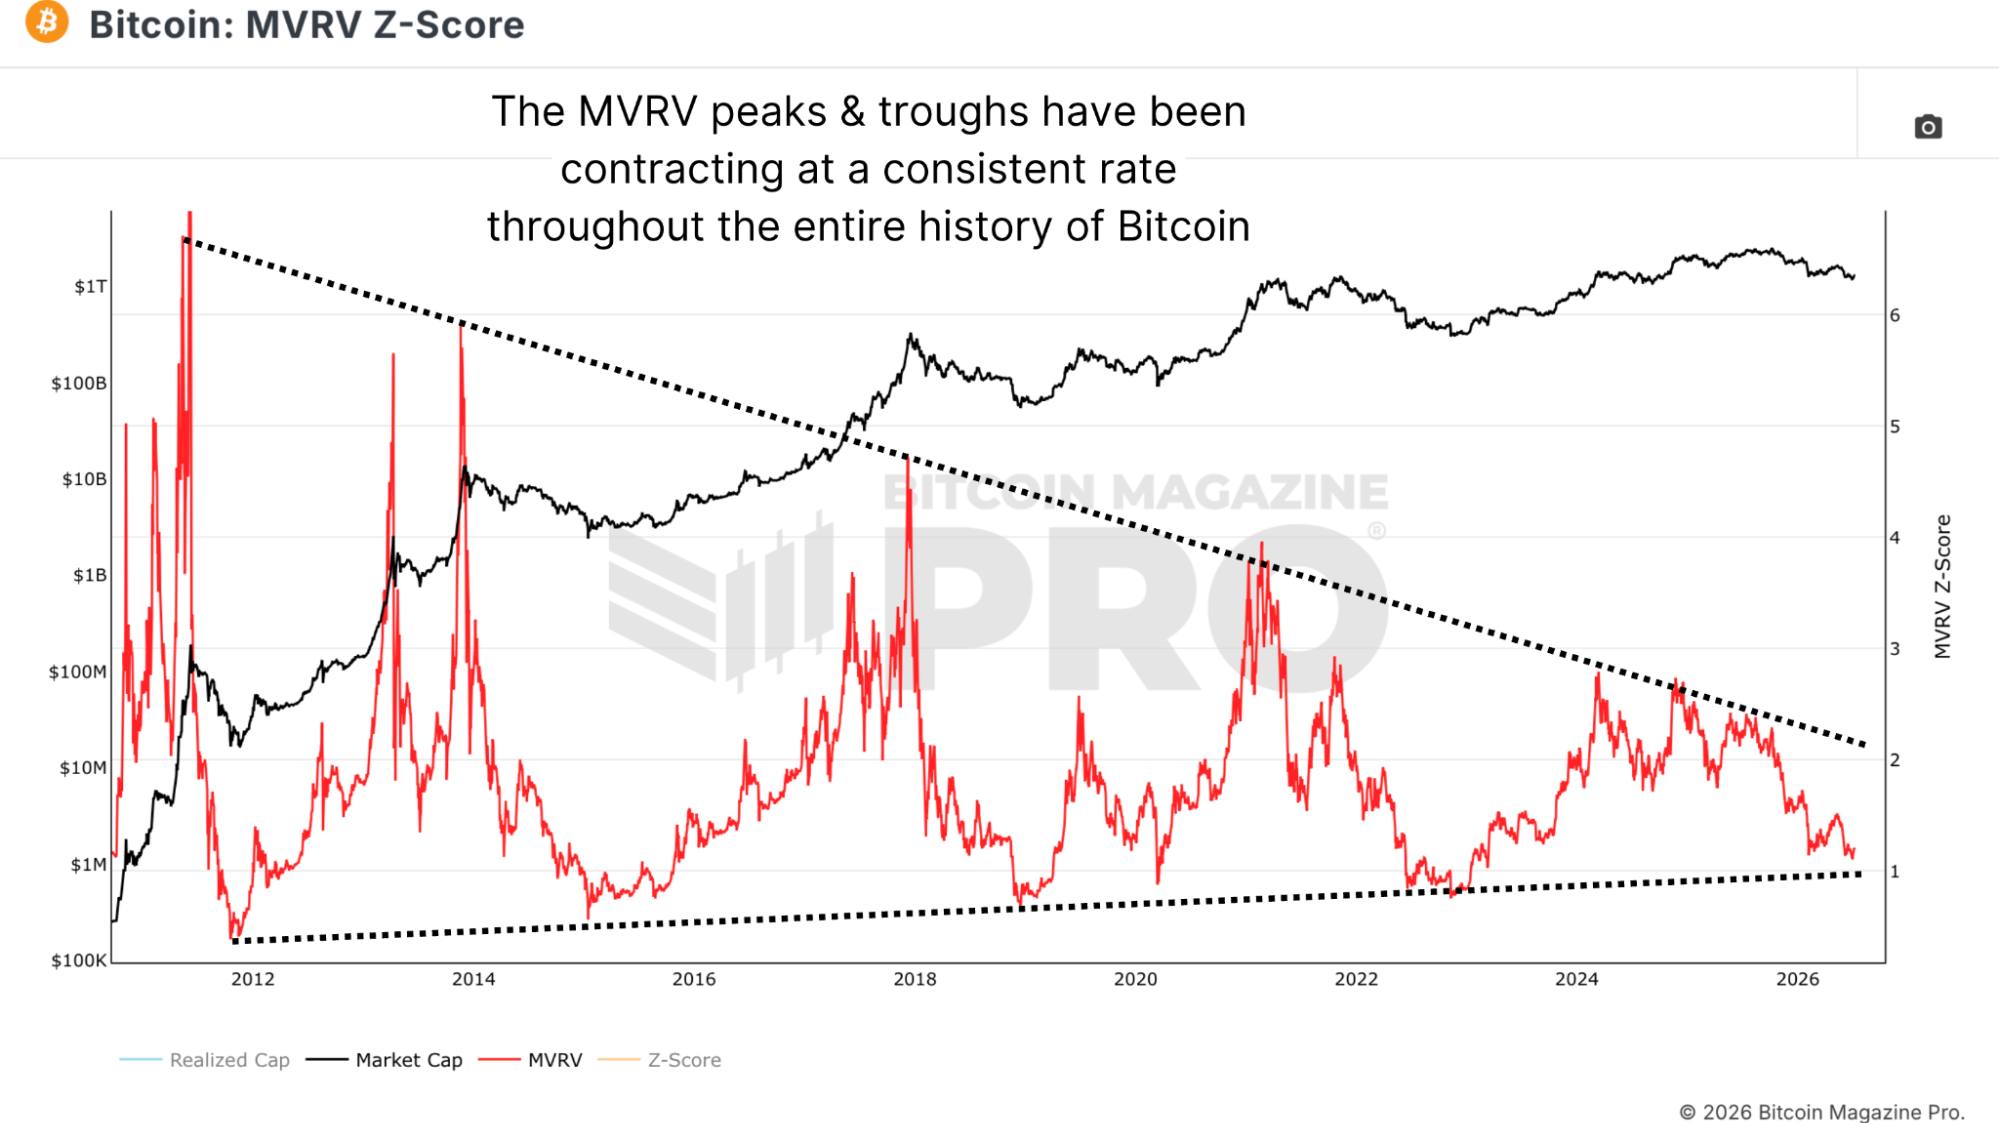
Figure 2: Bitcoin's MVRV ratio forms a wedge, with lower highs and higher lows each cycle.
Bitcoin has gone from a few million dollars in total value to multiple trillions. As the asset matures, as more supply is accumulated at progressively higher prices, and as volatility compresses, the extremes on both sides naturally shrink. The deviation above the average cost basis at each peak diminishes, and so does the depth of each dip beneath it.
The Trend
Rather than eyeballing lines on a chart, you can fit this mathematically. Taking the full history of MVRV data on a logarithmic scale and running a statistical line of best fit through the troughs produces a trendline that has been remarkably accurate, with the 2011 lows and the most recent cycle bottoms landing almost exactly on it, and the 2015 and 2018 lows sitting within roughly 10% of it.
This trendline has just crossed above 1.00. A reading of 1.00 is par, the point where price equals the realized price. The trendline sitting above that level implies that, on its current trajectory, Bitcoin's next major low arrives before price ever reaches the realized price at all.
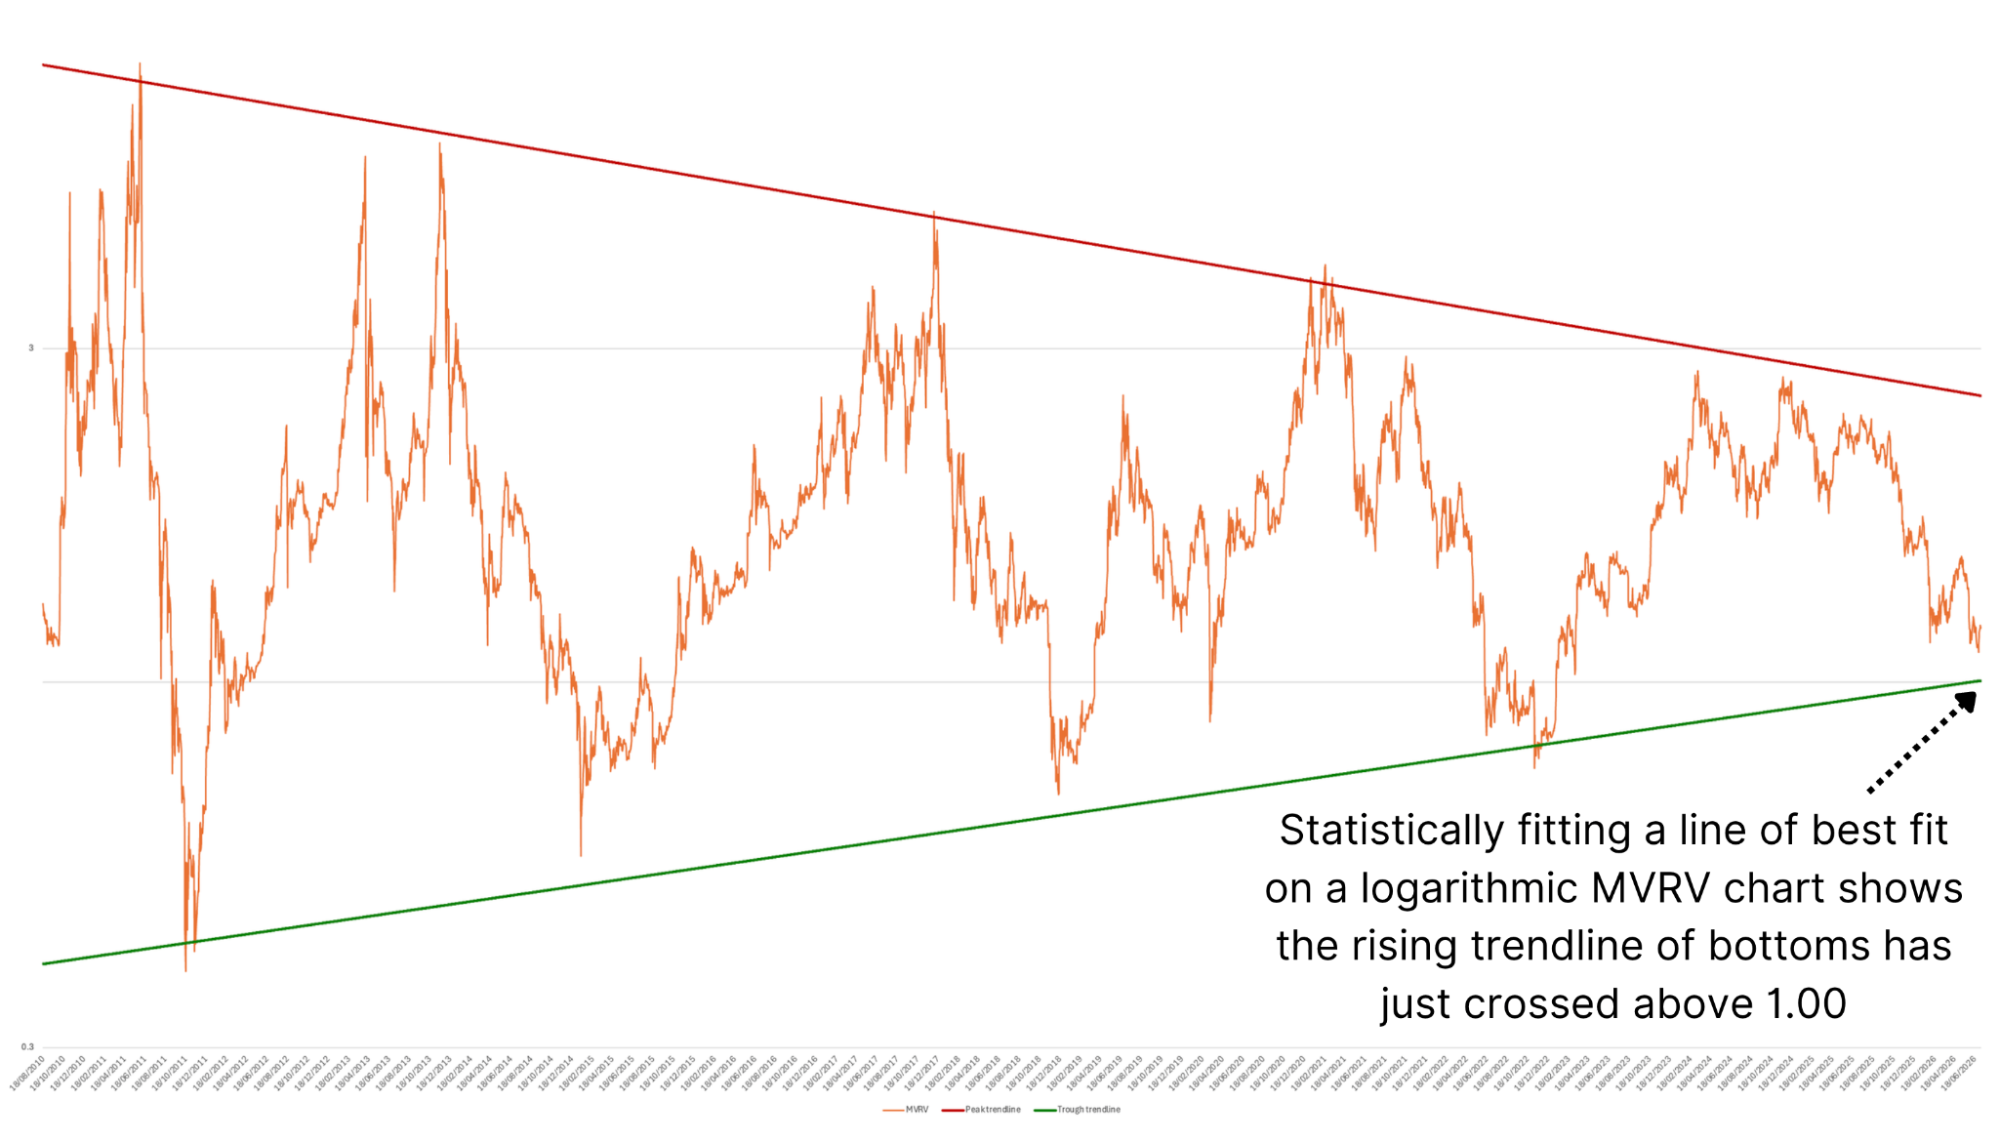
Figure 3: Bitcoin's MVRV trough trendline has recently crossed above par.
The realized price itself is currently trending down, so a dip into the mid/low $50,000s remains possible, and Bitcoin has spent time beneath this trendline before, in 2011 and briefly in 2022. But across the asset's entire history, that amounts to just 17 days, or 0.29% of all trading days. Put differently, on 99.7% of all days in Bitcoin's existence, price has held above this line. Waiting for $40,000 or $30,000 bitcoin means betting against essentially the whole of that record.
Long-Term?
The natural pushback is that Bitcoin has historically also dipped beneath the Long-Term Holder Realized Price, the cost basis of the market's most experienced participants. That level is on track to cross $50,000 within the next week or two, and if further downside does materialize, the standard realized price declining toward it while the long-term holder level rises to meet it would create a meaningful zone of confluence in the low $50,000s.
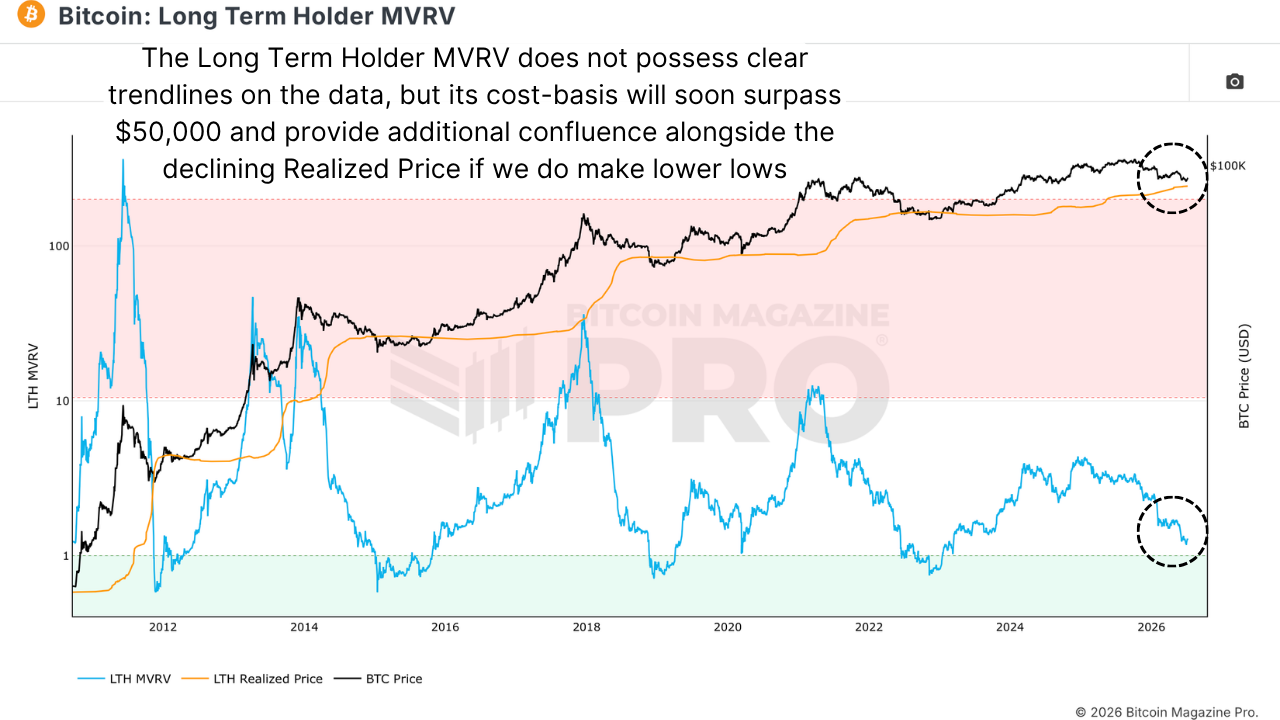
Figure 4: Long-Term Holder MVRV lacks clean trendlines, but its cost basis keeps climbing.
The Long-Term Holder MVRV doesn't produce trendlines as clean as the standard version; connecting its peaks gives little predictive power. But the underlying logic still applies, and arguably applies more strongly. That metric includes coins from over a decade ago, millions of which are lost or will simply never move again, accumulated at a few dollars each. As that dormant base grows, it makes structural sense that each dip beneath these cost basis levels becomes shallower with every cycle.
Takeaways
Could Bitcoin dip beneath the realized price this cycle? Yes, it has happened before, and a few days in the mid or low $50,000s is entirely within the range of outcomes. But the statistical trend through every trough in Bitcoin's history says each undershoot gets shallower, and the trendline itself now says the low may arrive above that point entirely.
Watch our most recent YouTube video here:
EVERYONE Expects Bitcoin To Break This Line, It's Held 99% Of The Time
Matt Crosby (@MattCrosbyPro)
Director of Research & Analytics
Any information on this site is not to be considered as financial advice. Please review the Disclaimer section for more information.