Where Does Bitcoin Actually Bottom - According To The Data?
March 13, 2026
Author: Matt - Director of Research & Analytics
This week, I want to try and figure something out. If Bitcoin continues moving to the downside, where does the data suggest it might find a floor? It's a question worth asking right now. Bitcoin has pulled back meaningfully from its highs, sentiment is poor, and the headlines are leaning bearish. That kind of environment is exactly when it helps to zoom out and look at what the historical data has actually told us about how deep Bitcoin bear cycles tend to go, and where the genuine accumulation zones have appeared in previous cycles.
CVDD
The first place to start is the Cumulative Value Coin Days Destroyed (CVDD), one of the more advanced on-chain valuation models available on Bitcoin Magazine Pro, and in my view, the most historically accurate tool we have for estimating where Bitcoin is likely to find a bottom during bear cycles. The CVDD essentially measures the cumulative economic weight of Bitcoin being moved on-chain, specifically coins that have been dormant for extended periods. When long-held coins finally move, it carries significant informational value about where value is being transferred and at what price.
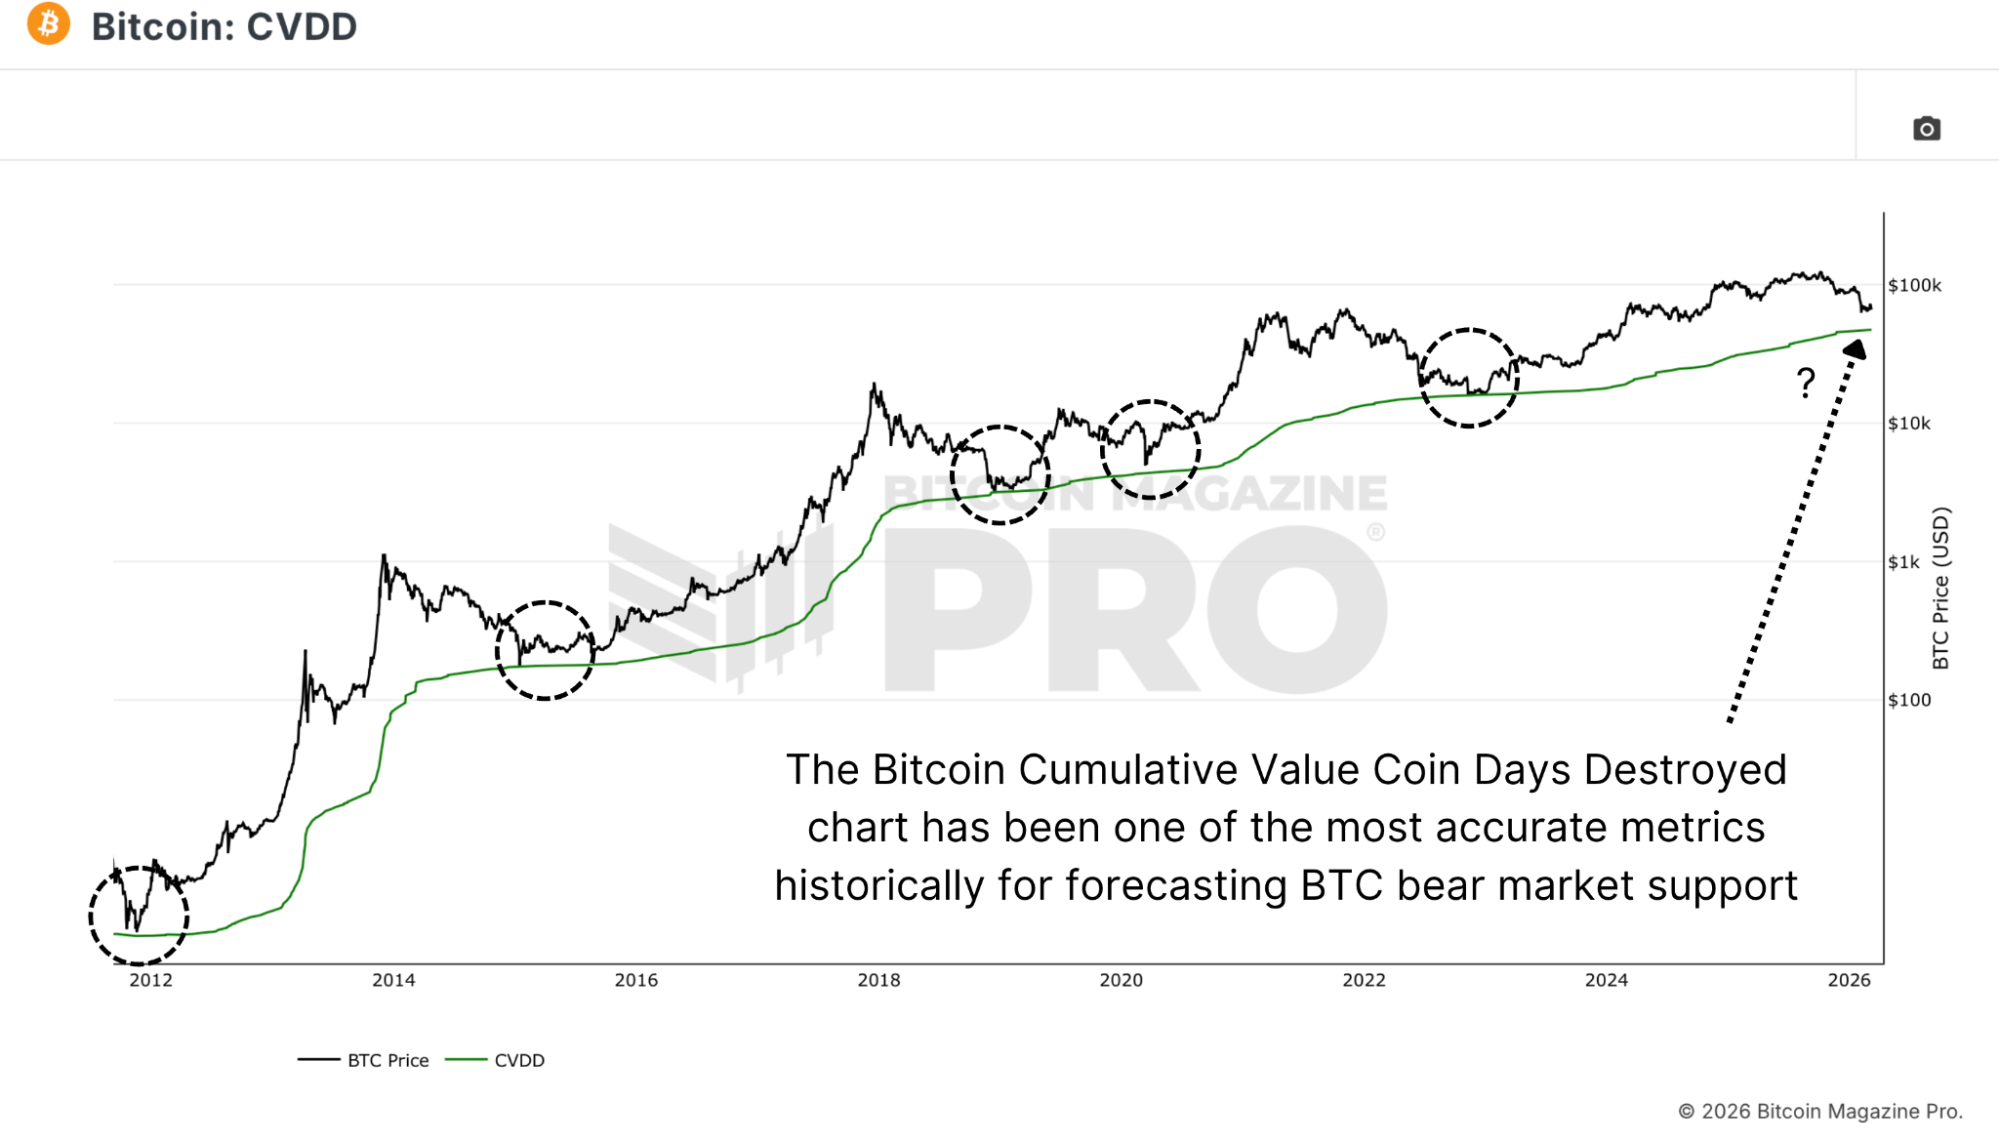
Figure 1: The Bitcoin Cumulative Value Coin Days Destroyed has historically predicted bear market bottoms with accuracy.
All the way back to 2012, when Bitcoin was trading at just a few dollars, the CVDD has consistently marked the approximate bottom of each Bitcoin bear cycle with a high degree of accuracy. Right now, the CVDD is sitting in the mid-to-upper $40,000s and trending upward. Based on its current trajectory, it's likely to be approaching the $50,000 zone within the coming months. That alone is worth paying attention to.
Realized Price
The next metric to look at is the Bitcoin Realized Price, arguably the most widely used and important on-chain metric in the space. The Bitcoin Realized Price is the average cost basis of every single Bitcoin in circulation. When Bitcoin's market price dips below the realized price, it means the average investor is sitting at a loss. Historically, these periods have represented genuine capitulation events and some of the best accumulation windows in Bitcoin's history. Currently, the realized price is sitting in the mid-$50,000s and trending downward.
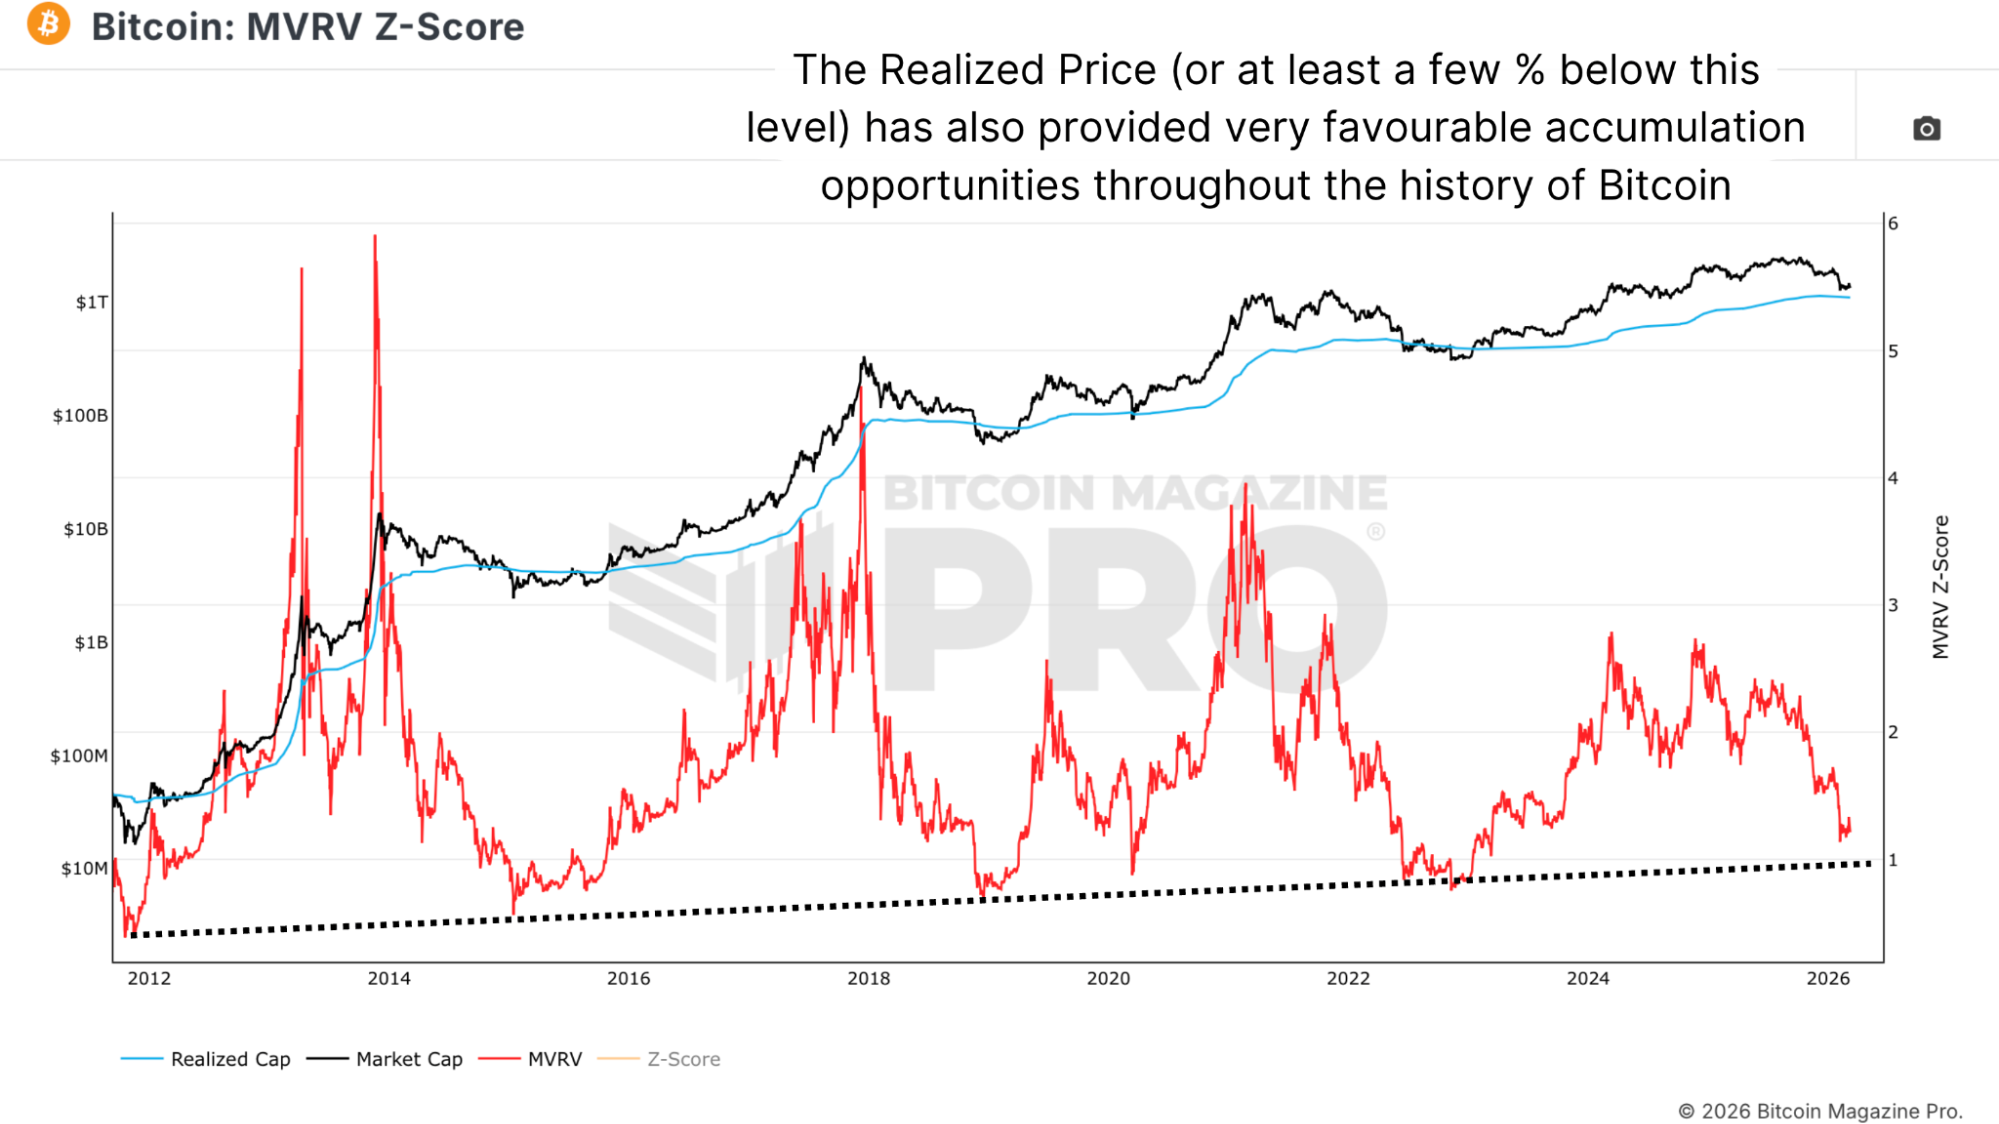
Figure 2: The Realized Cap & MVRV Ratio.
From the realized price, we can also derive the MVRV Ratio, the Market Value to Realized Value Ratio. This compares Bitcoin's current market cap to its realized cap. What we typically see in bear cycle bottoms is that Bitcoin trades somewhere between 10% and 30% below the realized price, but this downside divergence is decreasing consistently every cycle.
Long-Term Holder Realized Price
If the standard realized price is useful, the Long-Term Holder (LTH) Realized Price takes it one step further. This metric excludes newer market participants entirely and focuses only on the cost basis of Bitcoin's more experienced holders. The LTH Realized Price is currently around $42,500 and trending upward. Based on its current trajectory, it's on course to cross the $50,000 threshold somewhere around mid-2025. Again: more confluence pointing toward that same zone.
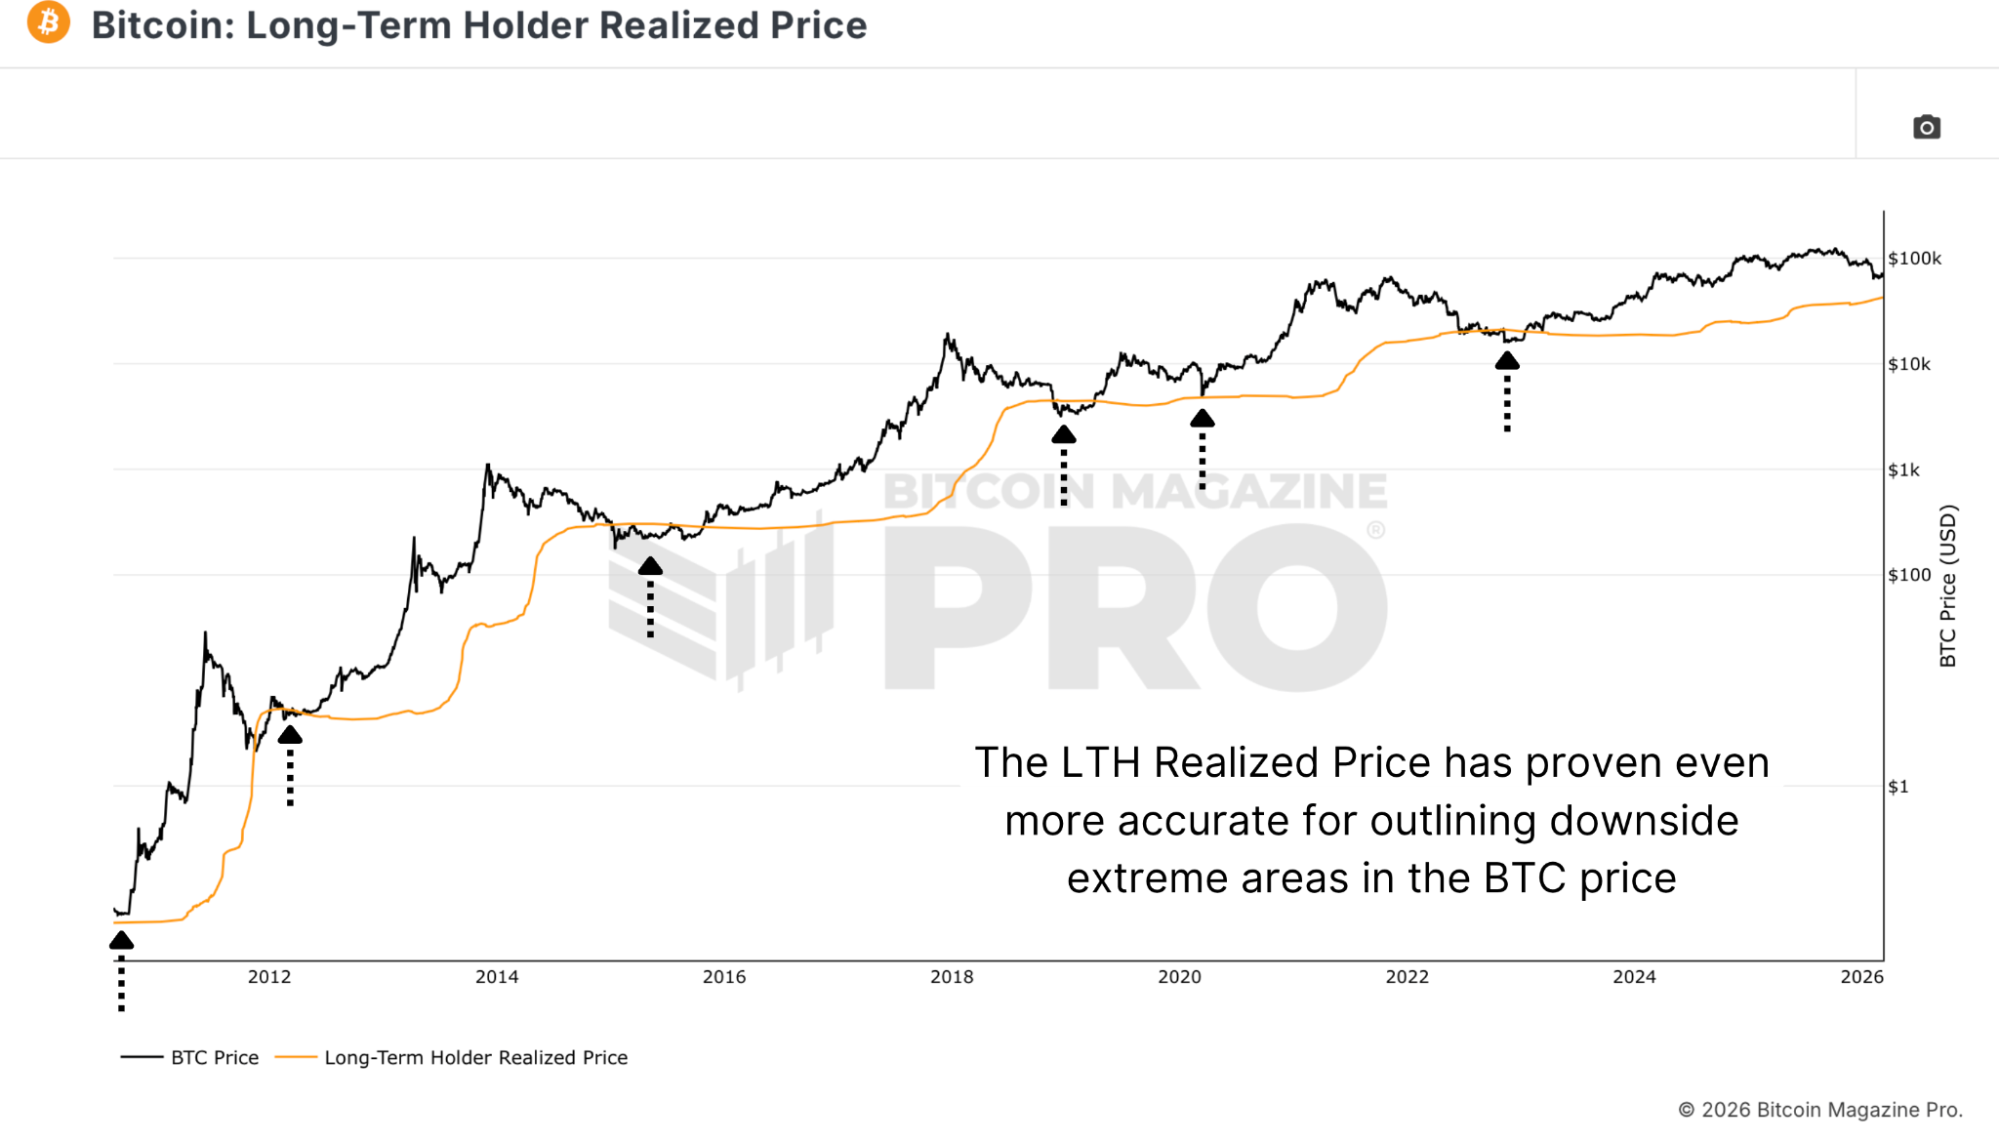
Figure 3: The Long-Term Holder Realized Price metric in action.
Historically, this metric has been even more accurate than the standard realized price as a bear market floor indicator. In the 2020 COVID crash, Bitcoin bounced almost exactly from the LTH Realized Price. In the 2022 bear market (excluding the FTX shock, which caused an exceptional brief undershoot), it again marked the approximate bottom.
The Puell Multiple
The Puell Multiple approaches the question from the mining side rather than the holder side. It measures daily Bitcoin issuance in USD terms relative to its 365-day moving average, essentially comparing what miners are earning today versus what they've earned on average over the past year. When that ratio drops to 0.5 or below, it has historically marked some of the best accumulation windows Bitcoin has produced. Miners become deeply unprofitable at these levels, capitulation pressure builds, and weak hands are shaken out.
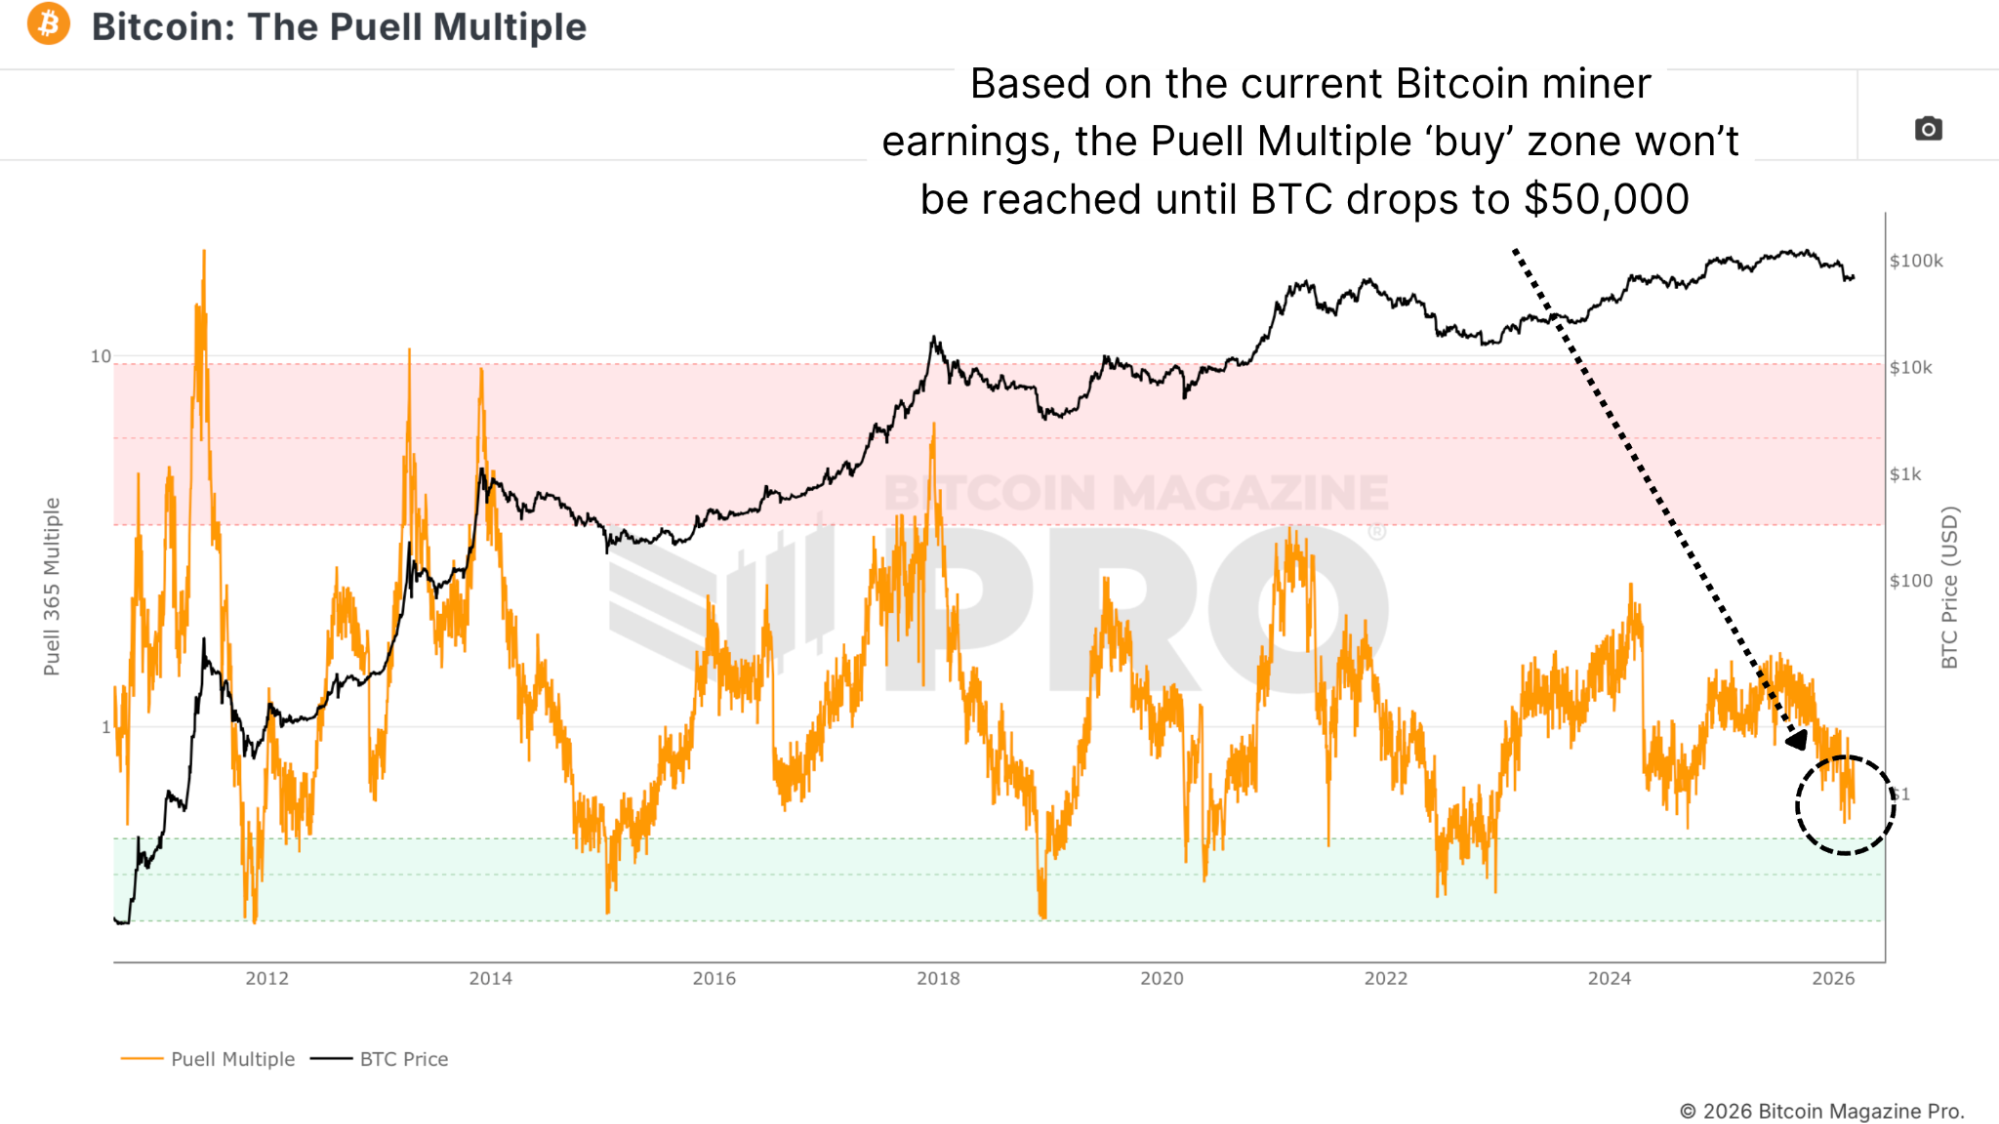
Figure 4: The Puell Multiple is heading towards significant accumulation levels.
Currently, the 365-day moving average of miner earnings is around $45 million per day. The accumulation threshold at a Puell Multiple of 0.5 puts that trigger at roughly $22.5 million per day. When you work backwards from that figure, dividing by the average daily block production of 144 blocks and then by the current block reward of 3.125 BTC, you arrive at a Bitcoin price of approximately $50,000.
Why $50,000 Has Always Mattered
On-chain and fundamental data aside, $50,000 is also one of the most significant technical levels in Bitcoin's history from a pure price action perspective. Going back through Bitcoin's past near decade of trading, $50,000 has served as resistance on multiple occasions, then converted to major support, and has consistently been a price point that the market treats as psychologically and technically significant. A move from Bitcoin's recent all-time high to the $50,000 zone would also represent approximately a 60% peak-to-trough retracement.
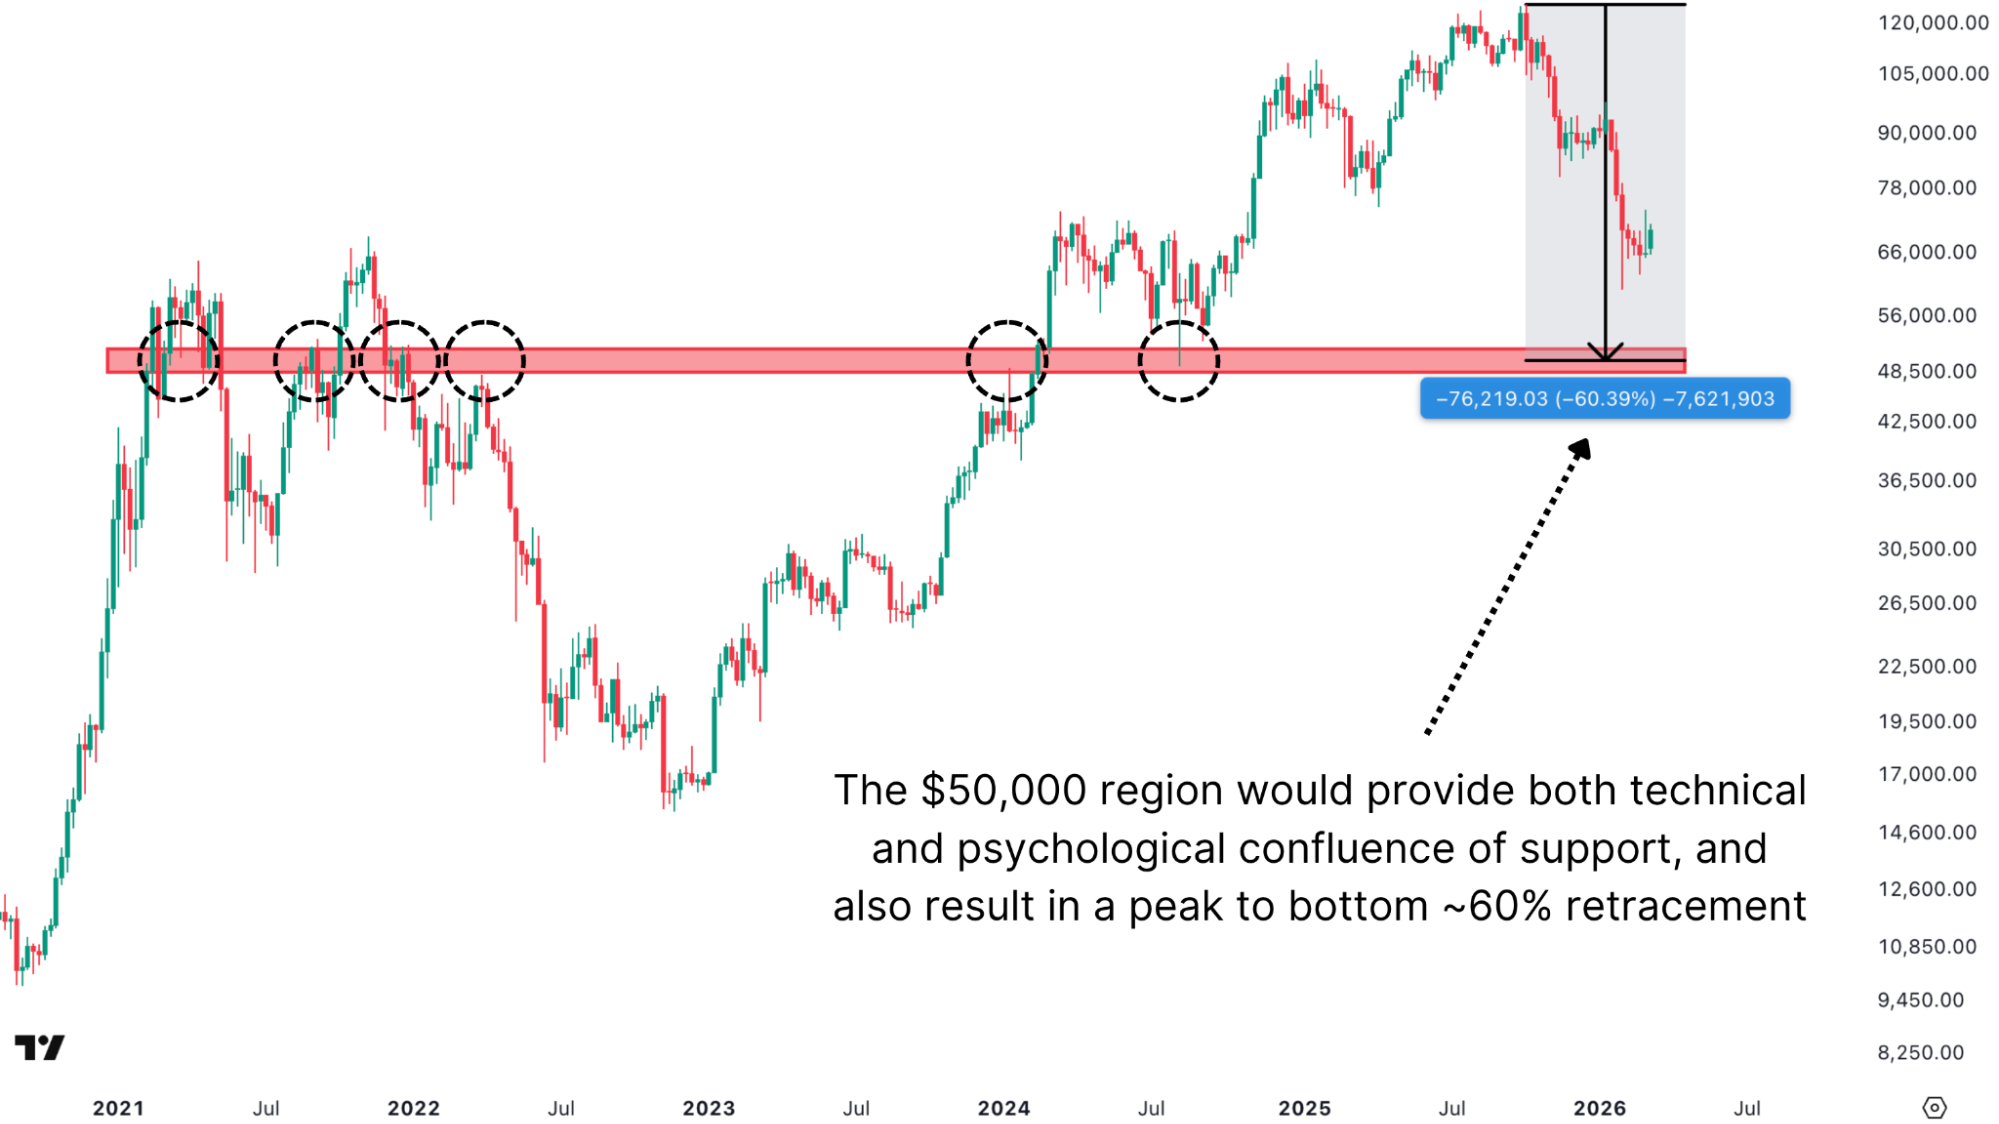
Figure 5: The historical significance of the $50,000 zone.
Closing Thoughts
Let me be clear about what this analysis is and isn't saying. None of these metrics guarantee that Bitcoin reaches $50,000. We may not get there at all. Bitcoin could also continue lower than these models suggest if macro conditions deteriorate significantly and we see sustained risk-off flows into safe haven assets, continued equity market weakness, or prolonged global uncertainty, then further downside is entirely possible. What the metrics I have covered here are saying is that if Bitcoin does continue declining, the confluence of evidence around the $50,000 zone is dense.
For a more in-depth look into this topic, watch our most recent YouTube video here:
How Bad Could This Bitcoin Market Get | Data Analysis
Matt Crosby
Director of Research & Analytics
Any information on this site is not to be considered as financial advice. Please review the Disclaimer section for more information.