The $31.27 Trillion Bitcoin Opportunity
May 8, 2026
Author: Matt - Director of Research & Analytics
GM. Whilst the most recent Bitcoin bull market made new all-time highs in dollar terms, it certainly didn't feel like it to most people, and there's a data-driven reason for that. This week, I’m explaining why measuring Bitcoin purely in US dollars can give a misleading picture, and what the broader lens of global wealth and relative purchasing power actually tells us about where Bitcoin sits right now and where it could go.
If you don’t have time to read the full thing:
- Bitcoin's year-on-year growth rate declined with every successive all-time high in the most recent cycle, a pattern also seen in 2021.
- Bitcoin still only represents approximately 0.25% of global wealth.
- Global wealth is projected to grow by around 75% to over $860 trillion by 2036.
- The Federal Reserve balance sheet is expanding again after a sustained period of contraction.
- Since the local low around $60,000, Bitcoin has reclaimed over 45% of relative purchasing power versus gold and has been outpacing equities.
Underwhelming
Bitcoin hit new all-time highs multiple times throughout 2025, peaking in October at around $126,000 on an intraday basis. Yet for most people holding through that period, it didn't feel particularly euphoric. The Bitcoin Price Year-on-Year chart explains why.
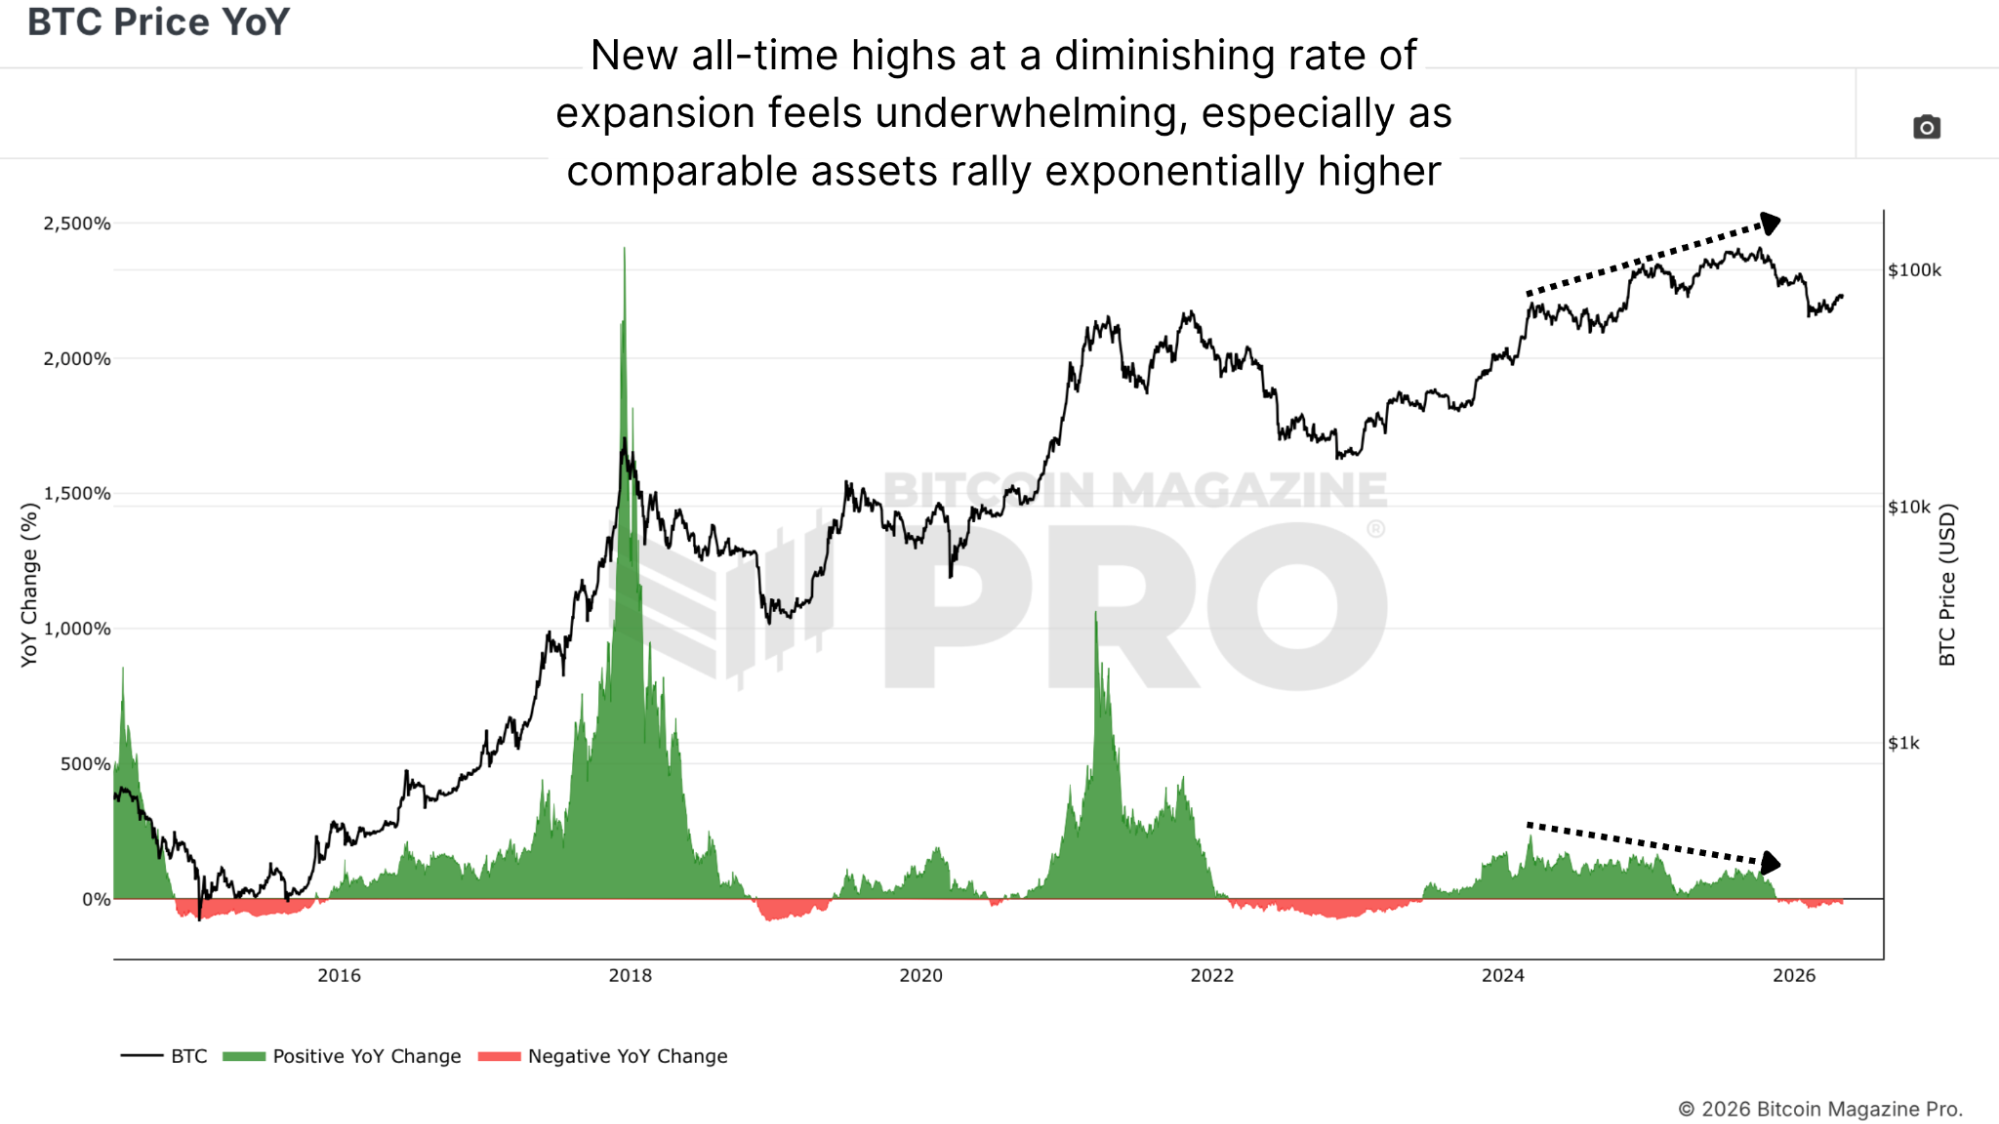
Figure 1: The diminishing rate of Bitcoin’s year-on-year change.
Every time Bitcoin made a new all-time high in the most recent cycle, the year-on-year growth rate was actually declining. The same pattern appeared in the 2021 double-peak cycle, with a higher dollar price, but with diminishing momentum.
When comparable assets are also rising rapidly, a new nominal high in a debasing currency can mask the fact that relative performance is underwhelming. The Bitcoin-to-gold ratio illustrates this clearly. The most recent cycle's peak in relative terms was not dramatically higher than prior cycle highs. Bitcoin versus gold barely made a new all-time high in this cycle, fractionally above 2021 levels, and is still only around 2017 peak levels.
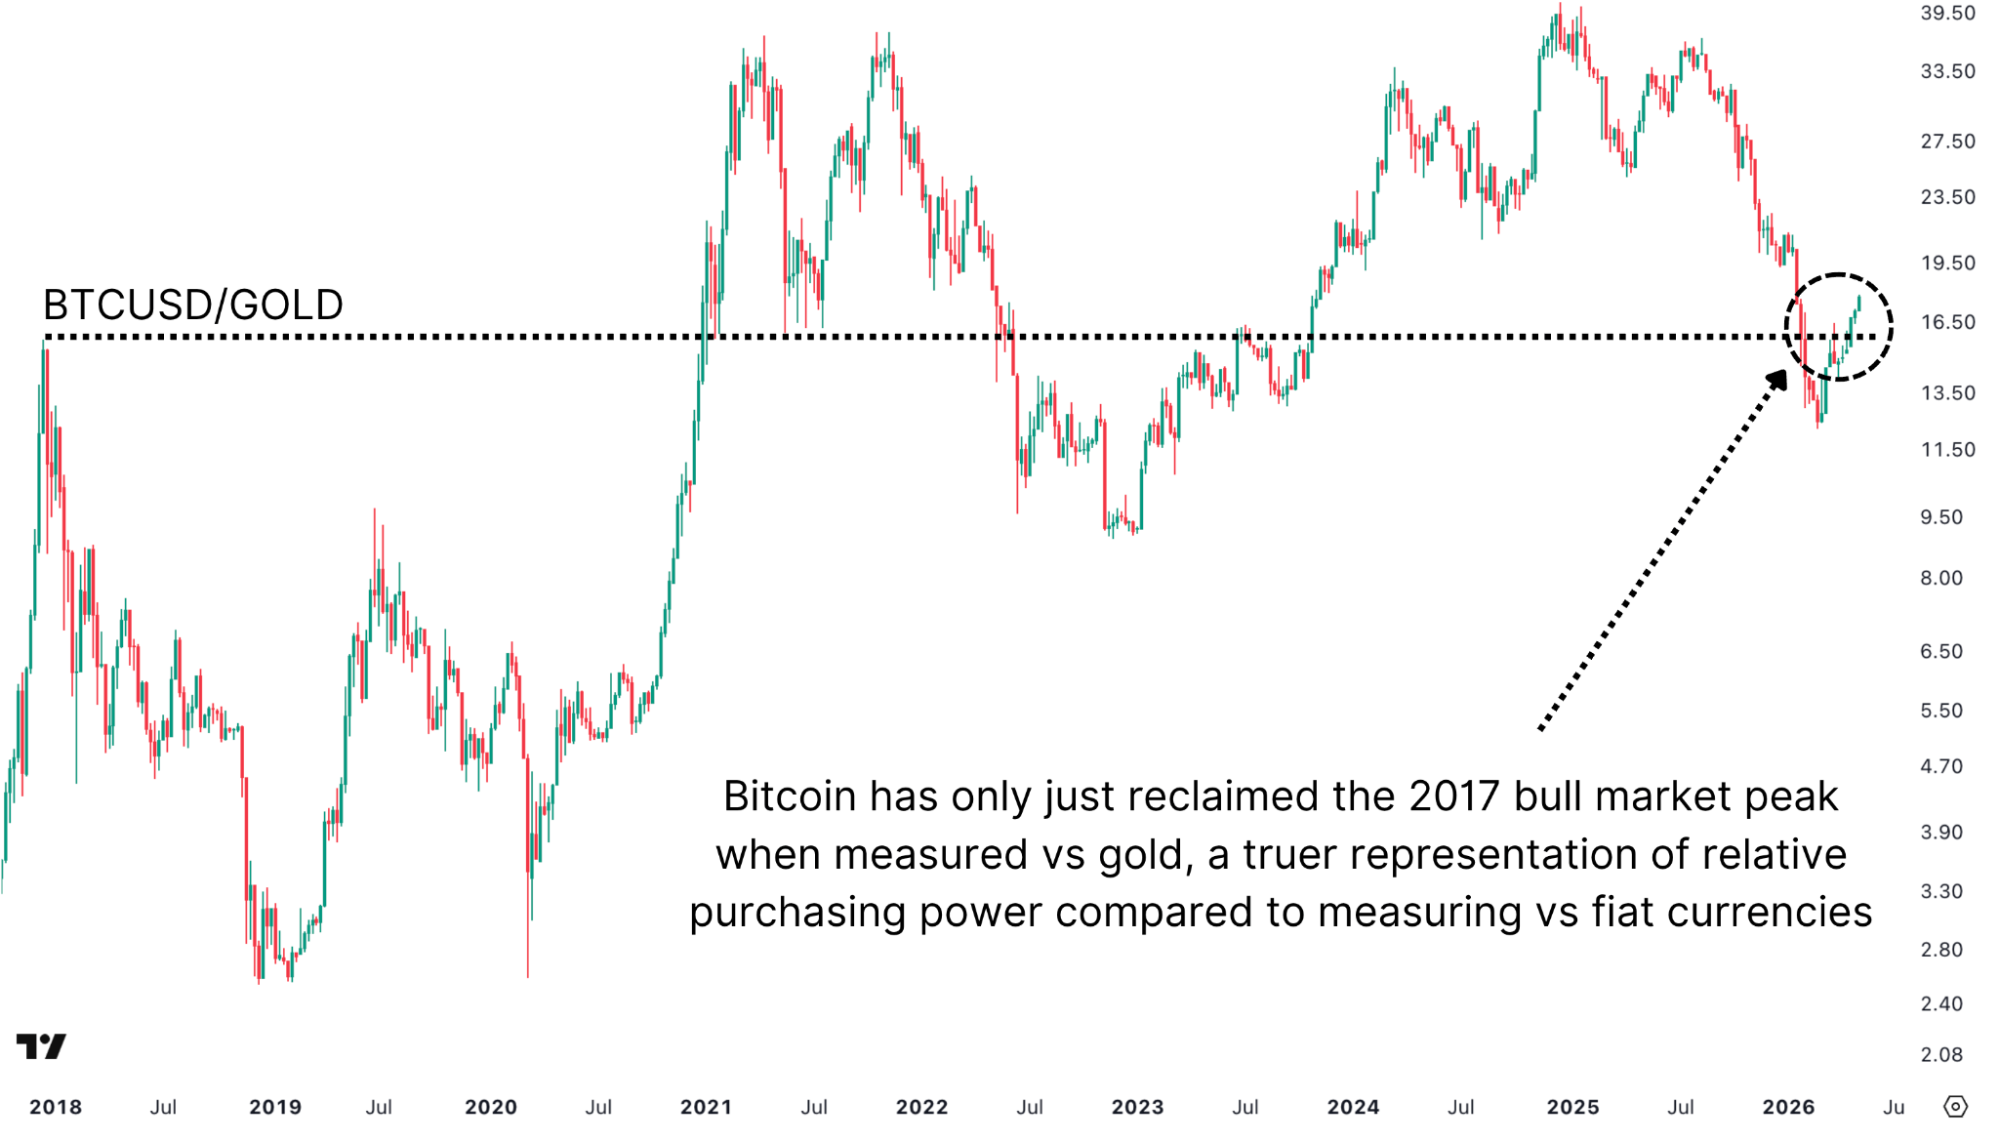
Figure 2: Measuring Bitcoin in terms of gold provides a truer view of relative purchasing power.
Global Wealth
Here's the framing that I think matters most right now. Bitcoin currently represents approximately 0.25% of total global wealth, a fraction of a percentage of the estimated $490 trillion pool of capital.
Global wealth has a long-term compounding growth rate driven by real estate, equities, bonds, commodities, and other stores of value. Projecting that rate forward, global wealth is on course to reach somewhere in the region of $860 trillion by 2036, an increase of close to $400 trillion from today. That figure will shift depending on macro conditions and any major dislocating events, but the directional trend is clear, and the historical precedent for that kind of expansion is well-established.
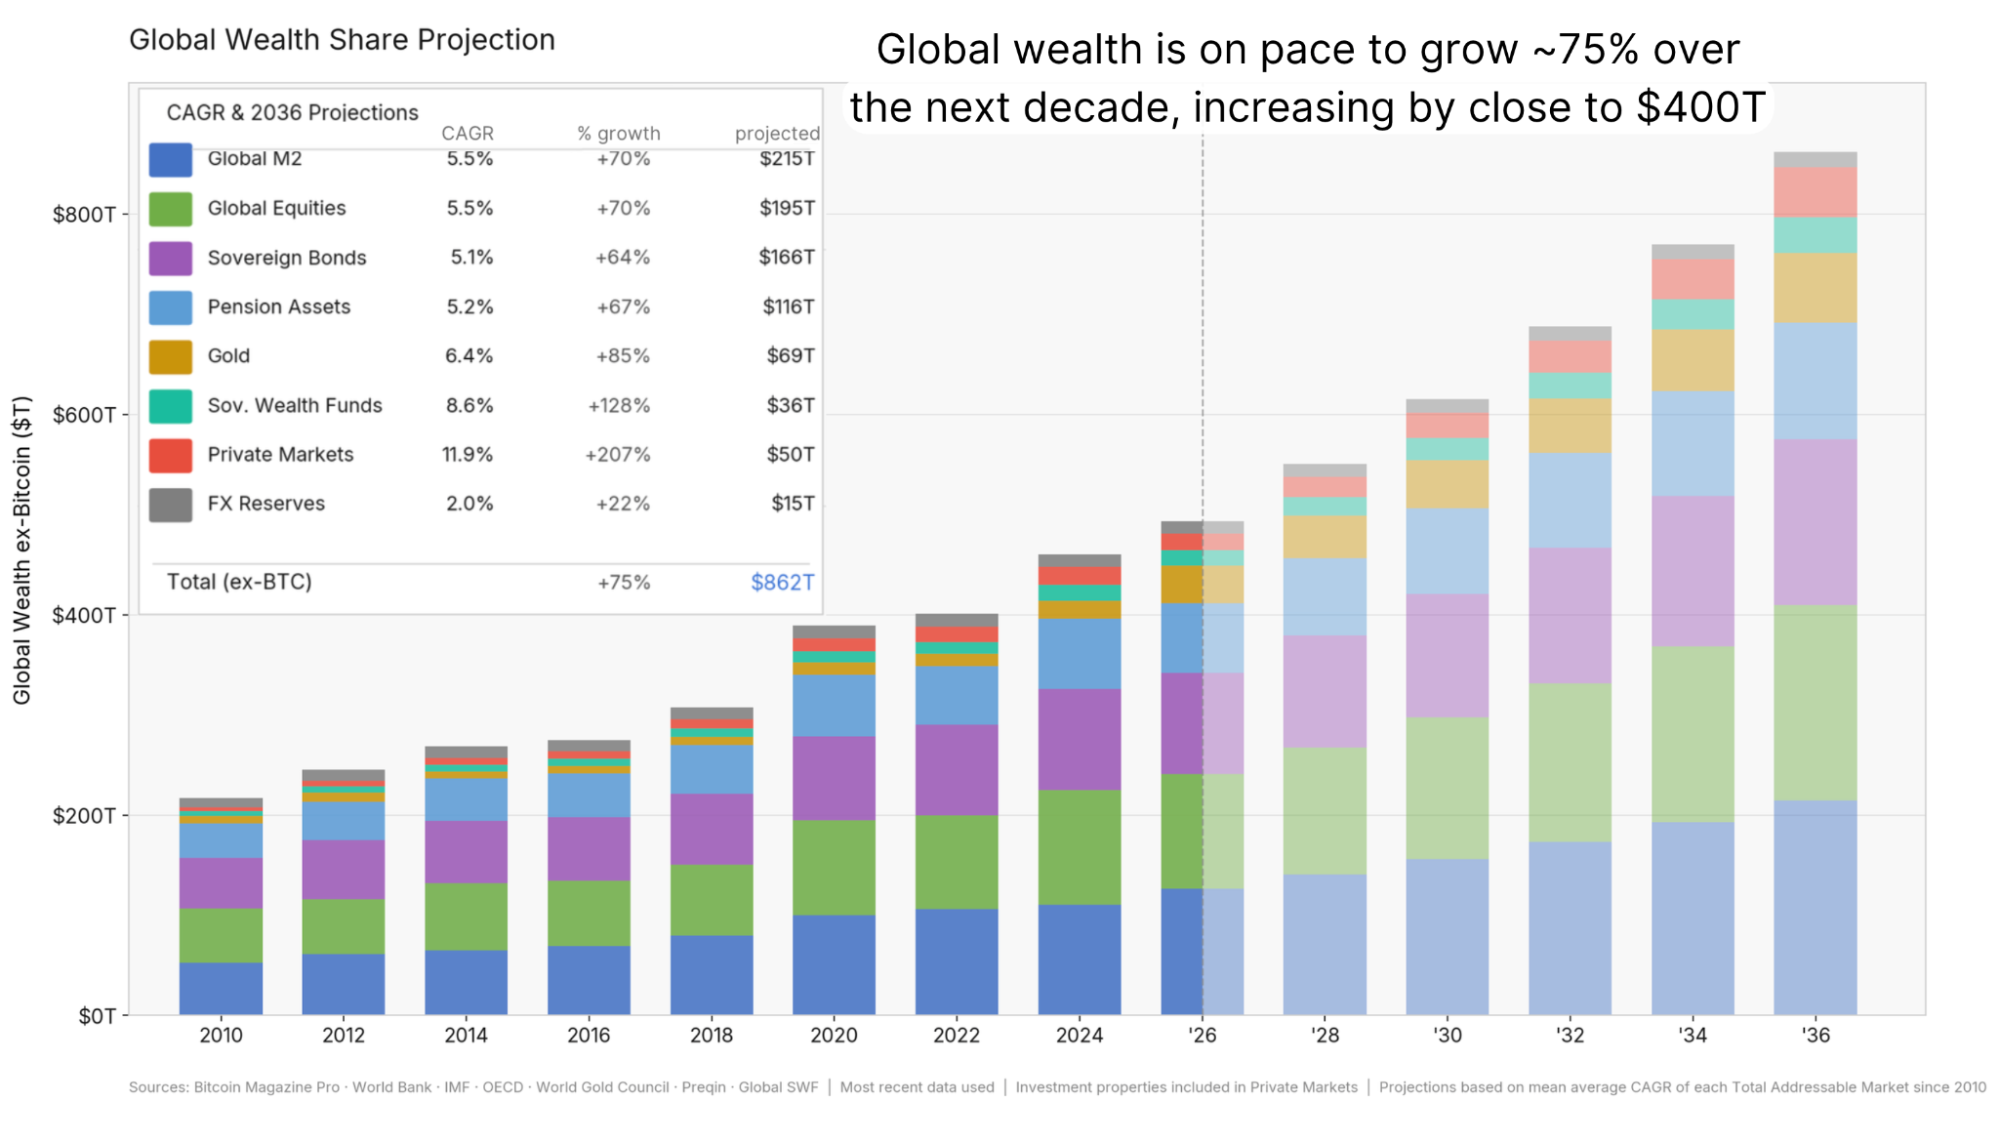
Figure 3: Past, current, and projected global wealth.
What this means for Bitcoin is that the target itself is moving. Even if Bitcoin only captures 1 to 2% of global wealth over the next decade, a modest claim given the trajectory of institutional adoption, ETF flows, and treasury company accumulation, the underlying prize is considerably larger than it was in prior cycles. Bitcoin doesn't need to outperform a static pool of capital. It needs to gain share in a rapidly expanding one.
Macro Tailwind
One of the most underappreciated aspects of the last Bitcoin bull market is the environment it ran in. Throughout 2023, 2024, and into 2025, the Federal Reserve Balance Sheet was in a sustained period of contraction, or quantitative tightening, reducing the amount of liquidity circulating in the financial system. Bitcoin made new all-time highs during that contraction.
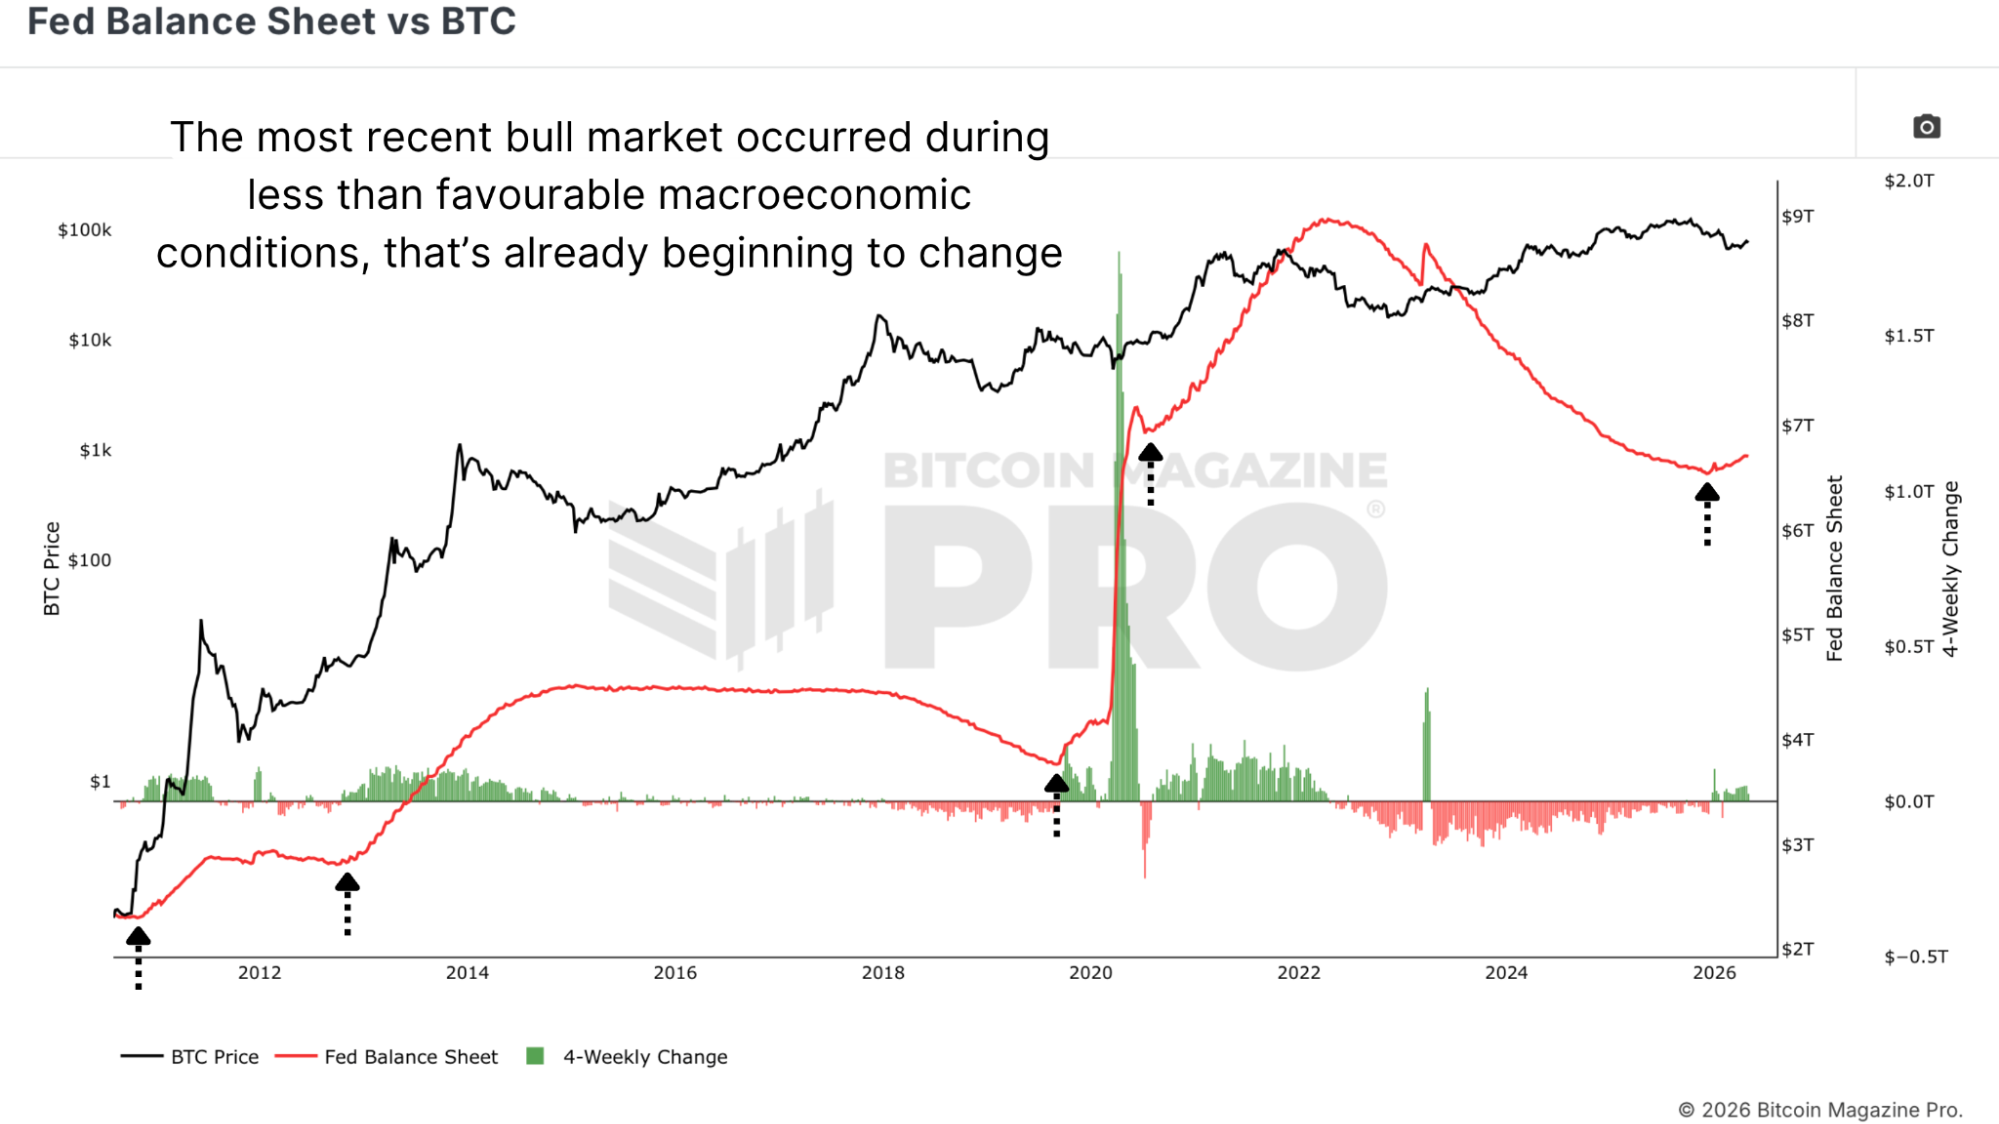
Figure 4: The last bull market occurred during a backdrop of quantitative tightening.
The balance sheet is now expanding again. Governments and central banks are once again adding assets, increasing the supply of money flowing through the system. Historically, periods of balance sheet expansion have coincided with the strongest phases of Bitcoin performance. The last cycle managed its run without that tailwind. The setup going forward has it.
Recovering Ground
Despite the underwhelming relative performance during the cycle peak, the picture since the local low has shifted considerably. Bitcoin has reclaimed over 45% of relative purchasing power versus gold since the bottom around $60,000. Even as the S&P 500 has continued pushing toward new highs in an environment of significant geopolitical uncertainty, the kind of conditions that would historically have been expected to weigh heavily on risk assets, Bitcoin is showing strong signs of recovering and catching ground.
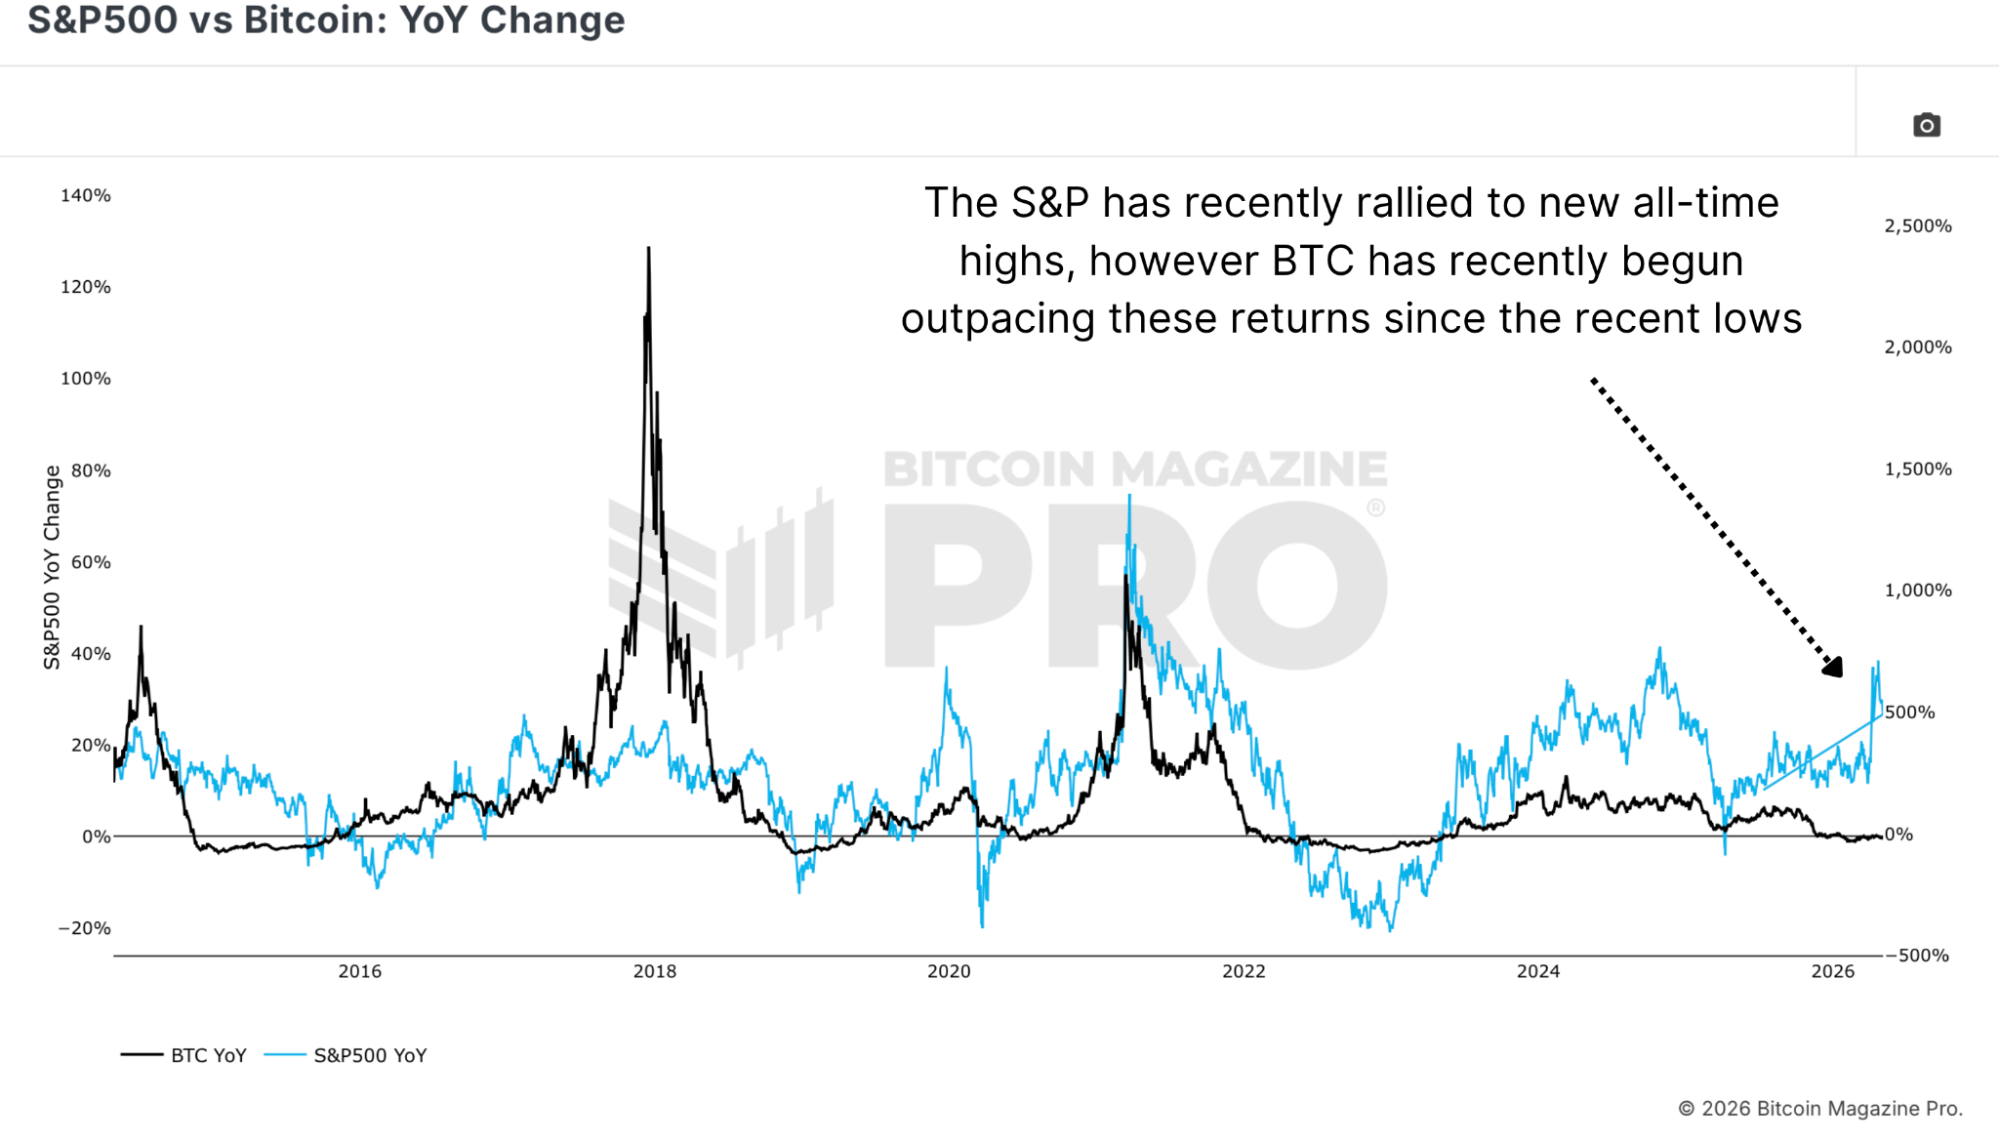
Figure 5: S&P500’s and Bitcoin’s year-on-year change.
Looking at Bitcoin's year-on-year returns plotted alongside the S&P 500's, the relationship between the two is visible and meaningful. When the macro environment turns more supportive, as the balance sheet data suggests it is beginning to, Bitcoin's correlation with equity strength has historically amplified its own moves.
Closing Thoughts
Measuring Bitcoin only against US dollars is measuring the right asset against the wrong benchmark. A currency losing purchasing power every year will always make a scarce asset look like it's gaining ground, whether it truly is or not. When you step back and look at Bitcoin's share of global wealth, its performance relative to comparable assets, and the macro environment it's operating in, a clearer picture emerges.
Bitcoin is at roughly a quarter of a percent of global wealth. That is both the honest assessment of where it sits today and the single most compelling argument for where it could go. The opportunity hasn't shrunk; the pool it's competing for has grown.
And watch our most recent YouTube video here:
$31.27 Trillion Bitcoin Opportunity — I Won't Miss It
Matt Crosby (@MattCrosbyPro)
Director of Research & Analytics
Any information on this site is not to be considered as financial advice. Please review the Disclaimer section for more information.