Rethinking One Of Bitcoin's Most Important On-Chain Thresholds
June 19, 2026
Author: Matt - Director of Research & Analytics
For years, on-chain analysis has relied on a single number to separate Bitcoin's committed holders from its short-term traders: 155 days. Hold your Bitcoin longer than that, and you're classified as a long-term holder. It's one of the most widely used thresholds in the entire field, and it underpins a huge number of the metrics analysts rely on every day. I’ve spent a considerable amount of time digging into whether a static threshold still makes sense, and built a more dynamic approach that I think is more accurate and more useful.
Let’s cut to the chase:
- The traditional 155-day long-term holder threshold is based on 2020 research and hasn't kept pace with how Bitcoin holding behaviour has changed since.
- A dynamic boundary that recalibrates daily currently sits at 114 days, 27% lower than the static standard.
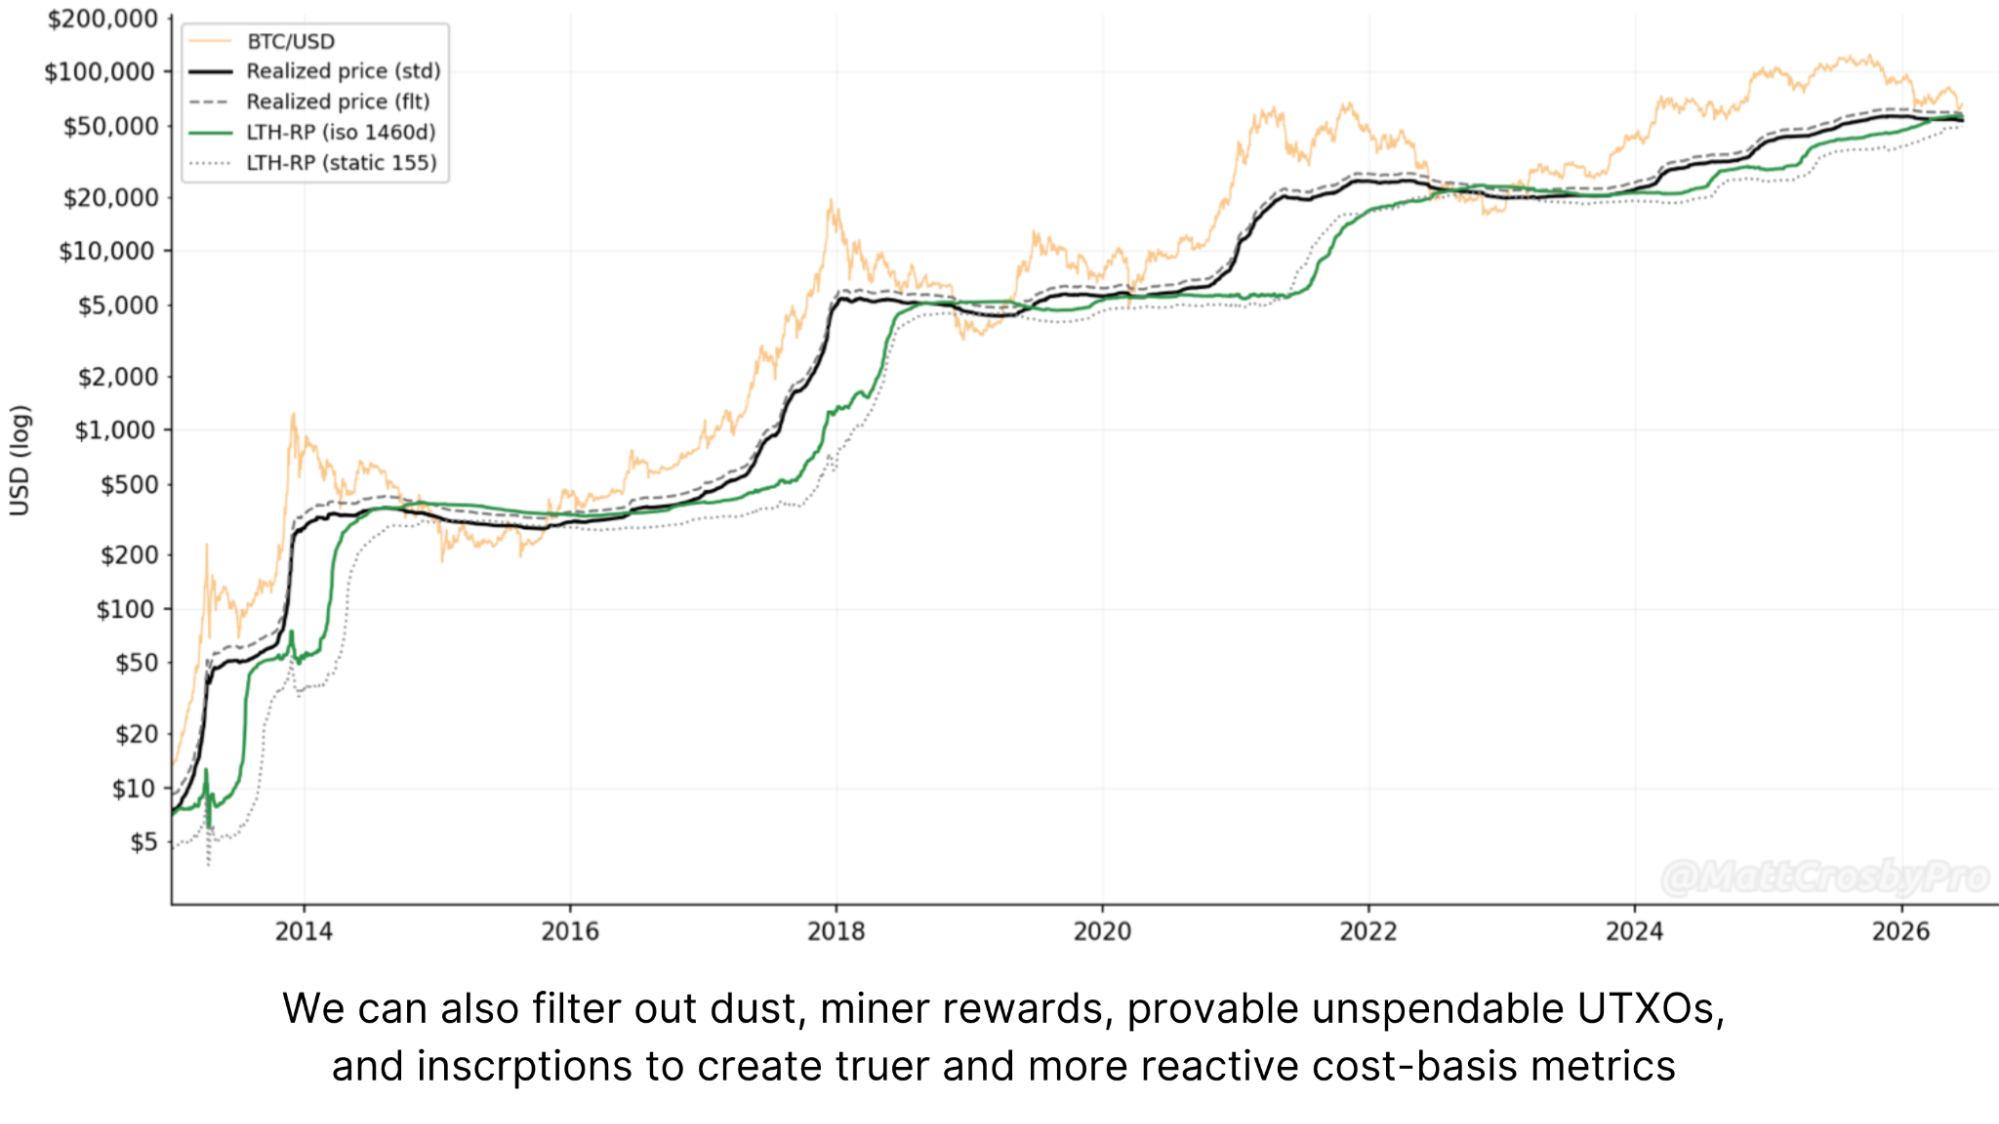
- Filtering out UTXOs that aren't really economic transactions produces a cleaner, more accurate Realized Price.
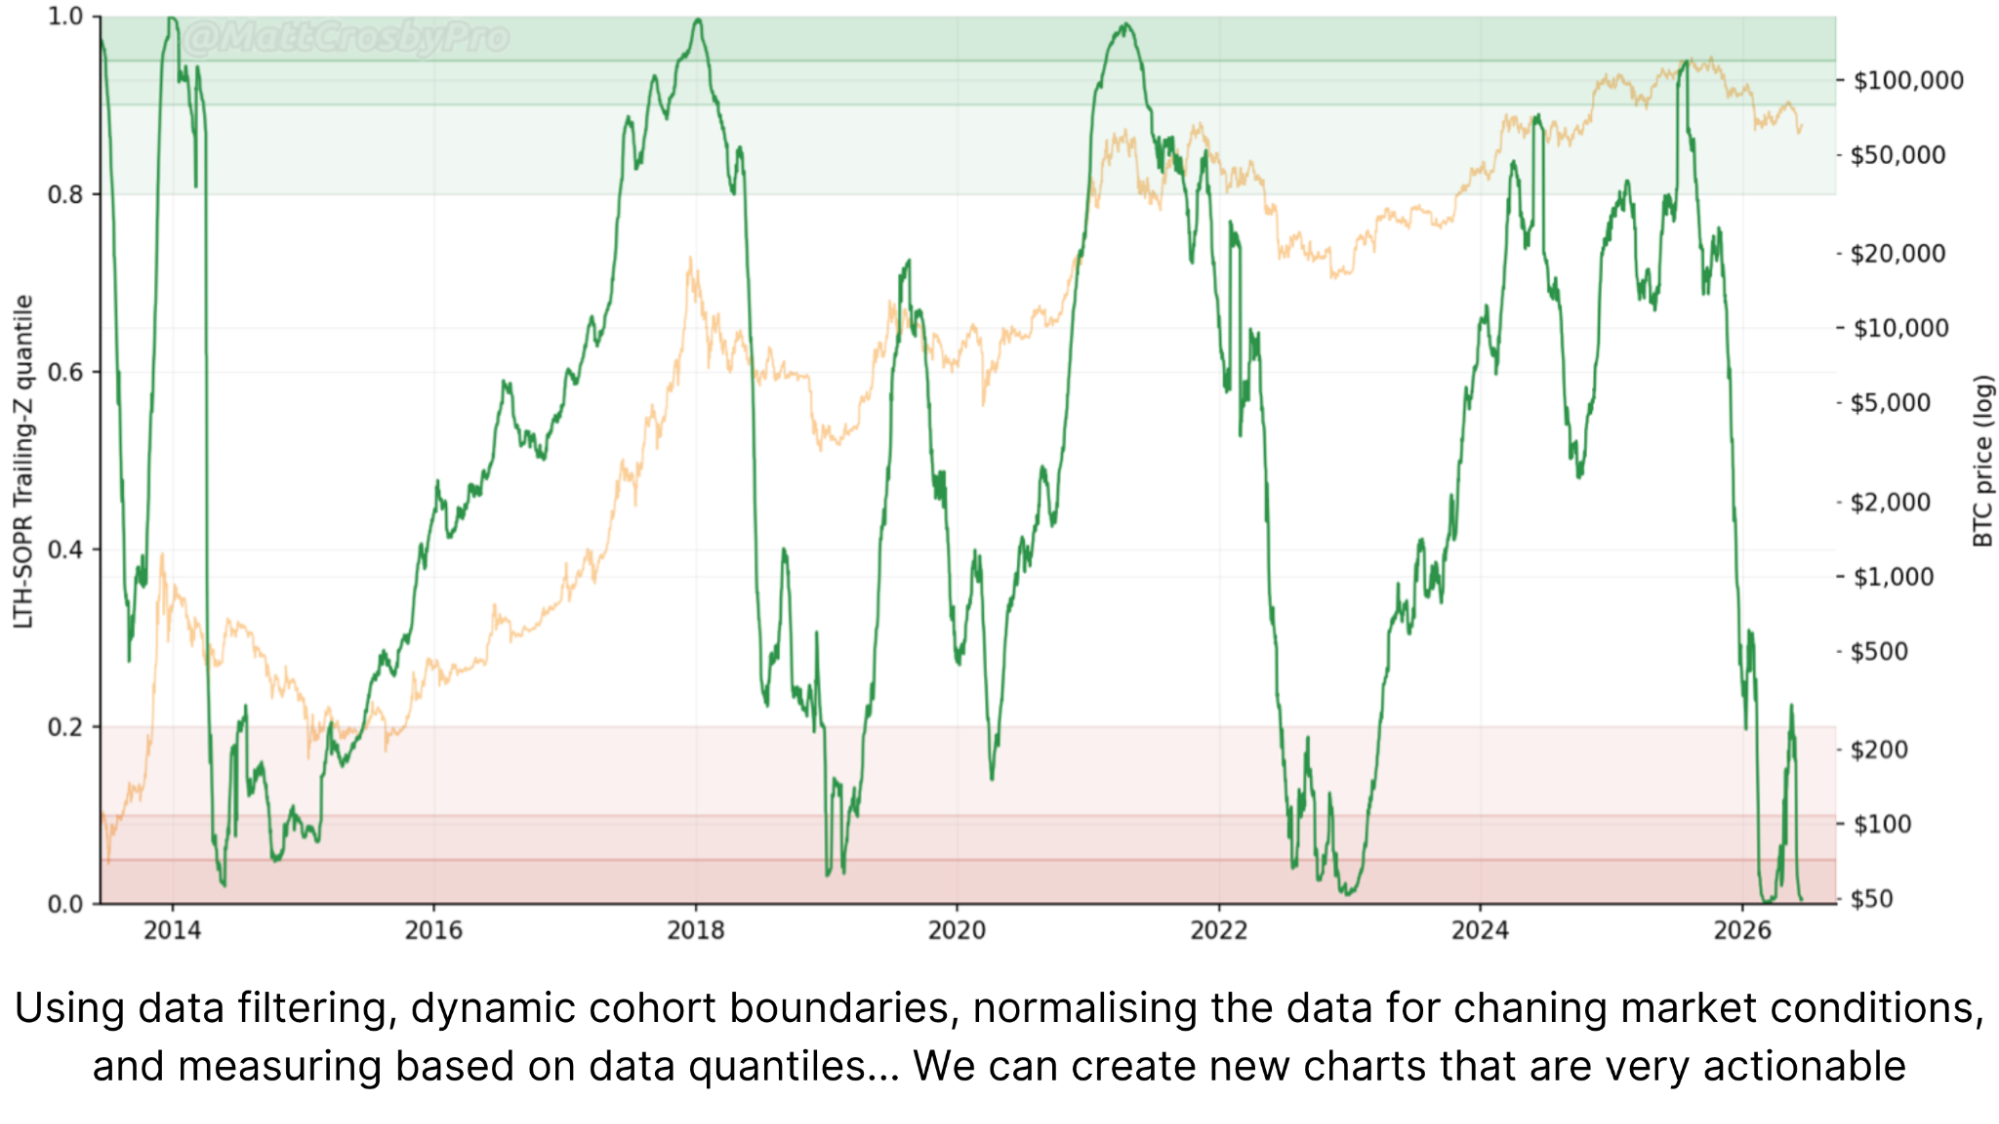
- Metrics rebuilt on this new boundary have historically marked cycle tops and bottoms with notable precision.
- On these new metrics, Bitcoin is currently sitting in deep value territory.
A Fixed Threshold No Longer Fits
The original logic behind the 155-day mark was sound. It's the point at which the probability of a holder spending their Bitcoin drops off sharply and then flattens out. Past that point, statistically, people tend to hold. The problem is that Bitcoin's holder behaviour has shifted dramatically. Fewer people are using it as a peer-to-peer payment system, and far more are holding it indefinitely as a store of value, driven significantly by ETFs and treasury companies.
When the broad behaviour of the network changes this much, a fixed threshold set six years ago starts to potentially misrepresent what's actually happening on-chain. So rather than a static number, the approach here uses a boundary that recalibrates every single day based on the entire history of Bitcoin transactions. Right now, that dynamic boundary sits at 114 days.
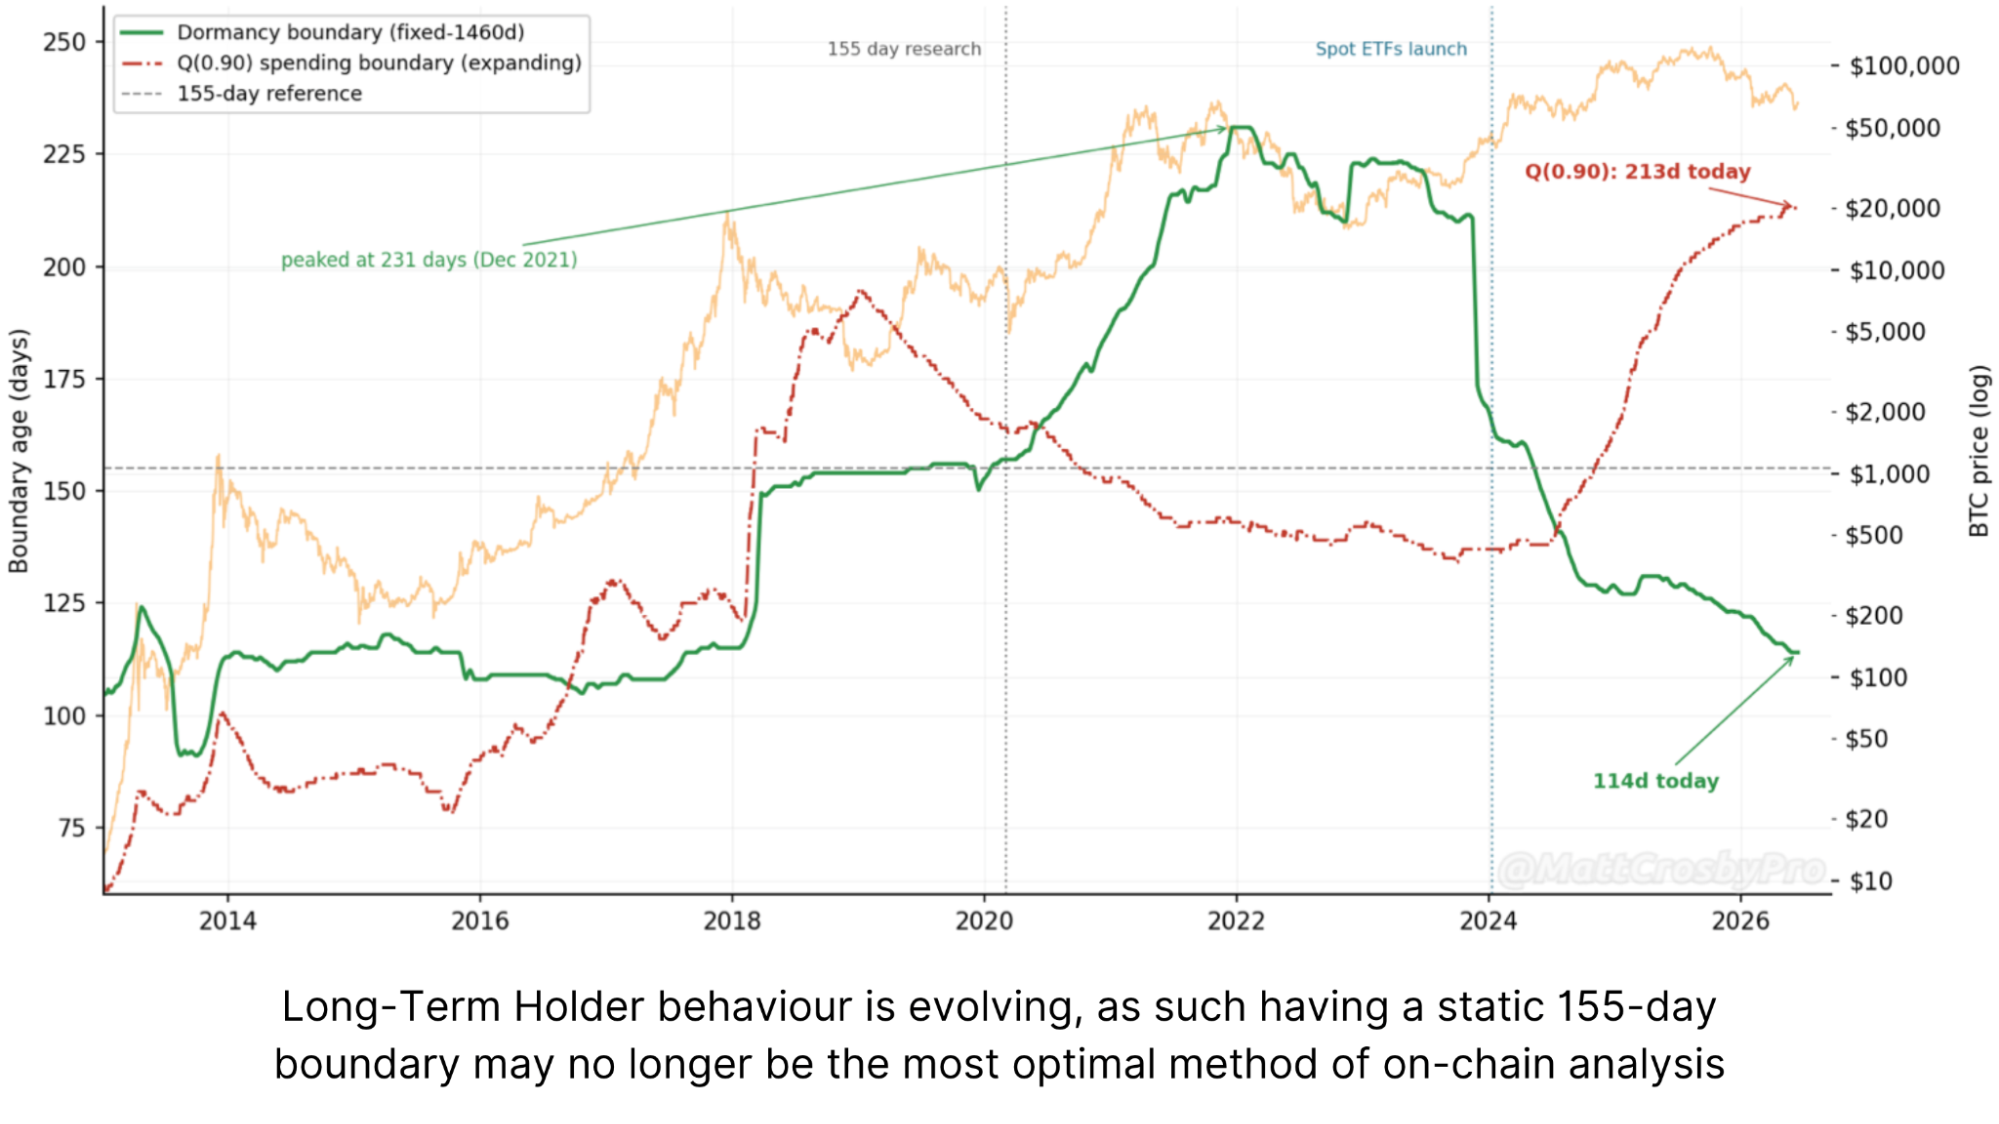
That might sound counterintuitive, a lower threshold for "long-term." But it makes sense because people are holding as a store of value more than ever, and the point at which spending probability drops off now arrives sooner. You don't need to hold as long before your likelihood of selling falls away significantly.
A Cleaner Realized Price
The second piece of this is the Realized Price, the average cost basis of all Bitcoin on the network, and arguably the single most important on-chain metric out there. The issue is that "all Bitcoin on the network" includes a lot of things that aren't really economic transactions.
There's Bitcoin dust, which would cost more to send than it's actually worth and is effectively unspendable. There are genuinely unspendable outputs. There are inscriptions, which exploded in volume from 2023 onward and aren't really value-transfer transactions in any meaningful sense. And there are freshly mined coins, which arrive every ten minutes and aren't immediately spent, so counting them at issuance and again when they eventually move risks double-counting. Filtering all of that out produces what I'd consider a truer realised price. It sits slightly higher than the standard version, because it stops counting the cost basis of coins that will realistically never move again.
More Actionable Signals
The real test of any new methodology isn't whether it's clever, but whether it produces something more useful. So I rebuilt the standard on-chain metrics on this new foundation. The long-term holder SOPR, which measures whether long-term holders are selling at a profit or a loss, becomes considerably sharper when built on the dynamic boundary and viewed through historical quantiles. It has marked Bitcoin's major cycle tops and bottoms with notable precision. Right now, it's sitting at a reading comparable to the recent $60,000 low, and some of the lowest levels it has ever recorded.
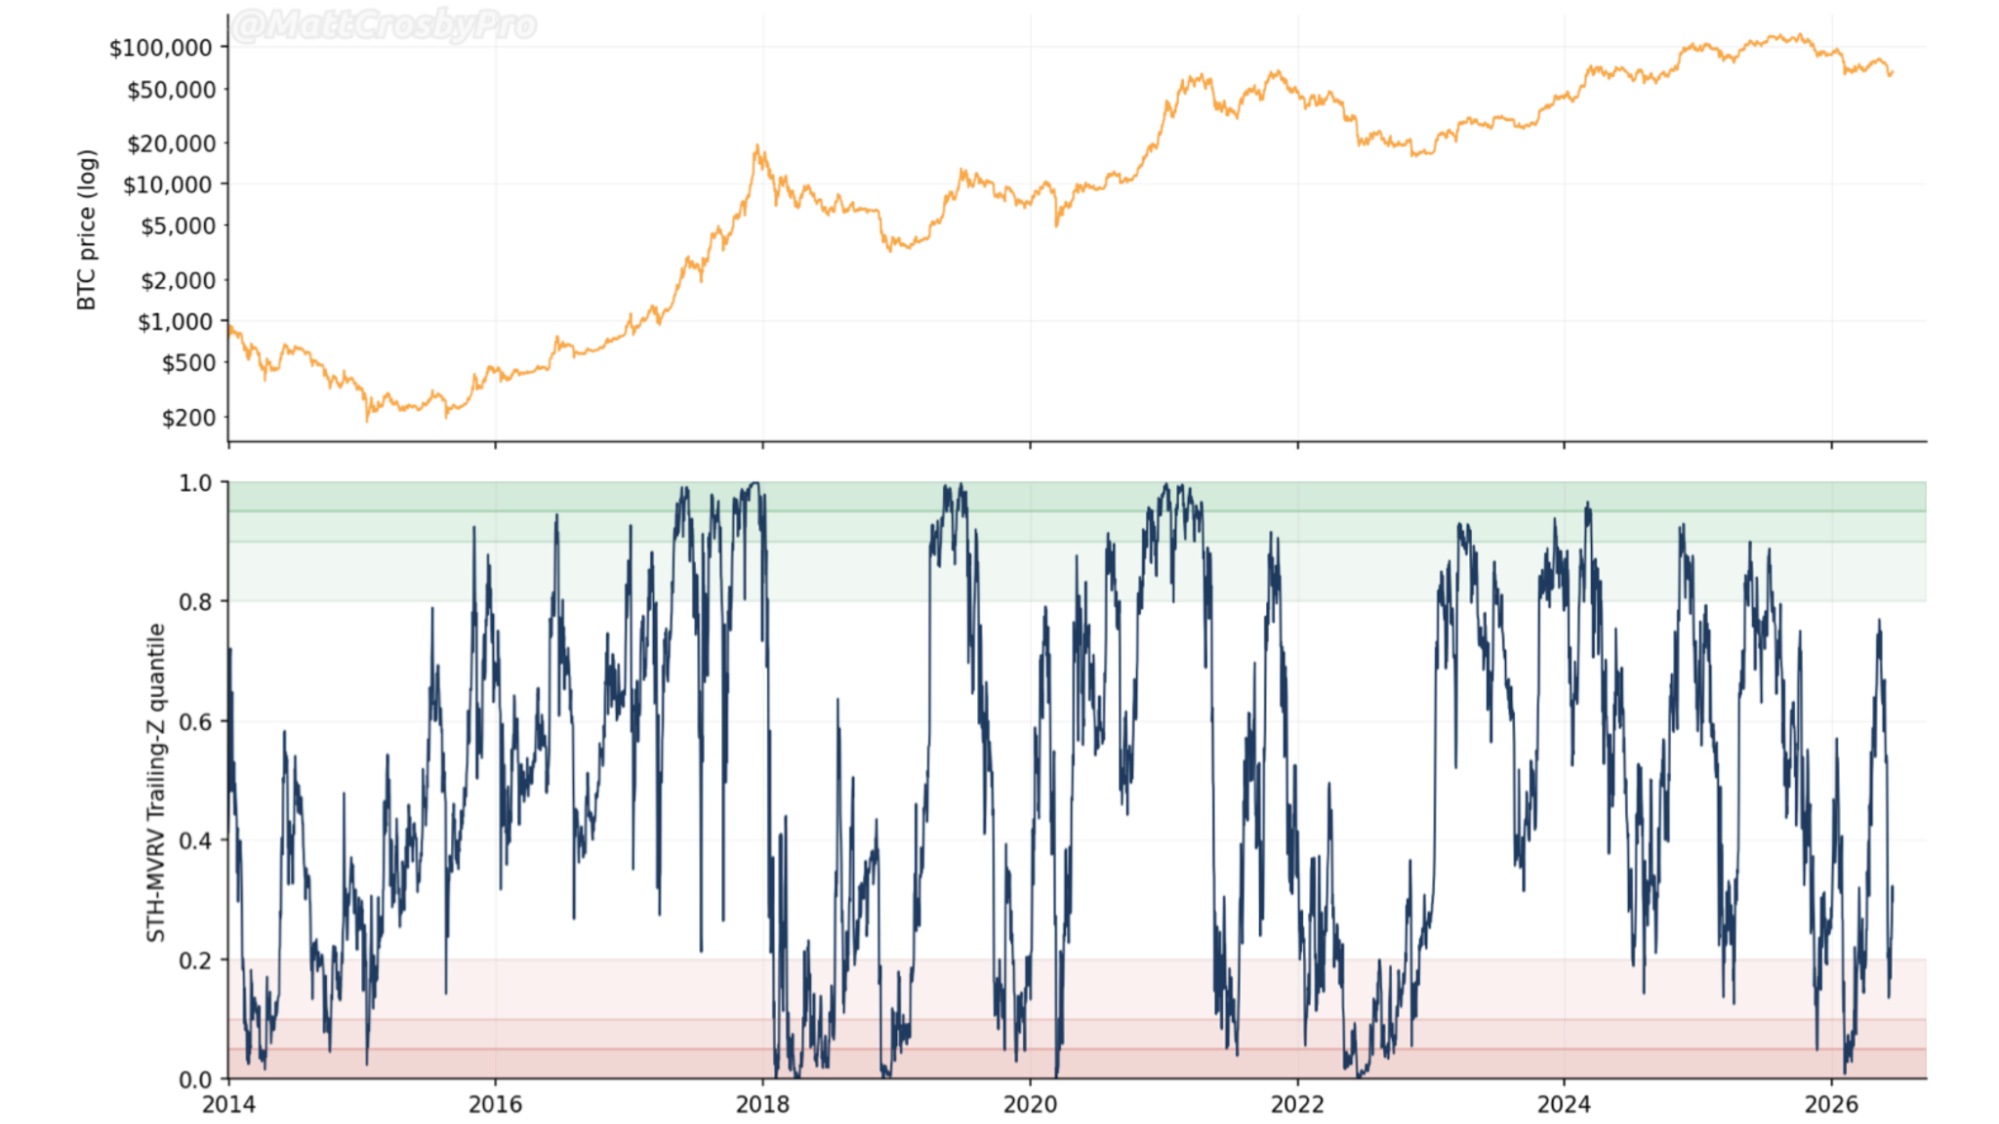
Applying the same approach to Short-Term Holder MVRV produces a similar improvement. The big upside spikes align with major price rallies, and the deep downside readings align with major turning points.
Where We Are Now
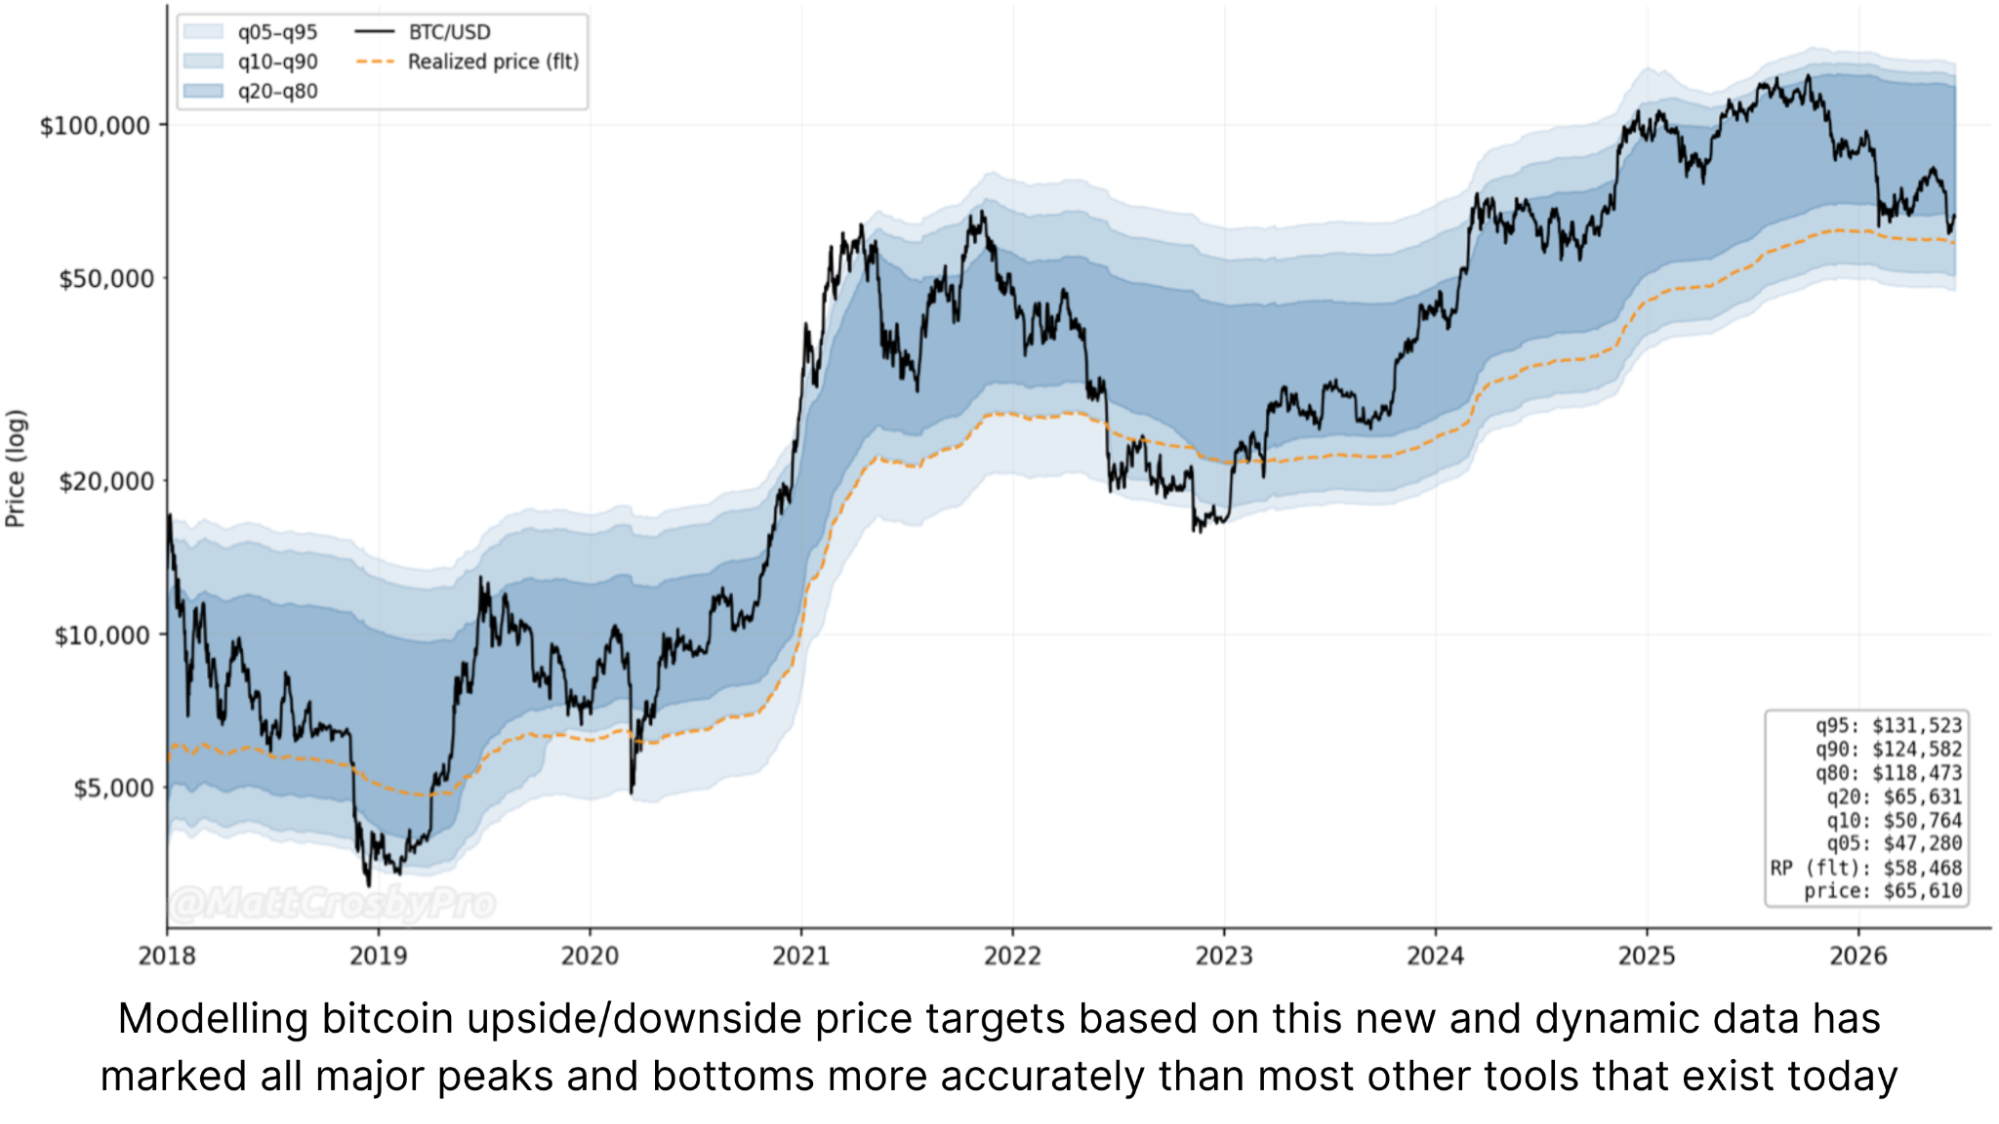
Taking this quantile methodology and applying it to the filtered realized price produces upper and lower bands, a rough gauge of where Bitcoin might be heading based purely on real on-chain fundamental data, with no historical repainting. Viewed on a reactive, variable basis rather than through fixed thresholds, it's been remarkably actionable.
Wrapping It All Up
Bear markets are for building. Rather than just waiting out the downside, this is exactly the kind of period to do genuinely useful work, and reworking one of the foundational thresholds of on-chain analysis felt like a worthwhile place to start.
This is a first effort, and it's fully open. Every formula and filter used is published so anyone can replicate it, test it, and improve on it. If the methodology can be made better, that benefits the entire space, and that's the whole point. The metrics built on this new boundary appear more accurate, more reactive, and more actionable, and right now they're all pointing to Bitcoin currently being in deep value territory.
And watch our most recent YouTube video here:
I Rebuilt Bitcoin's 155-Day Holder Metric: It’s Now Even More Accurate
Matt Crosby (@MattCrosbyPro)
Director of Research & Analytics
Any information on this site is not to be considered as financial advice. Please review the Disclaimer section for more information.