 Global M2 vs BTC
Zoom in with touchscreen: Touch and hold with ONE finger then drag.
Zoom in on desktop: Left click and drag.
Reset: Double click.
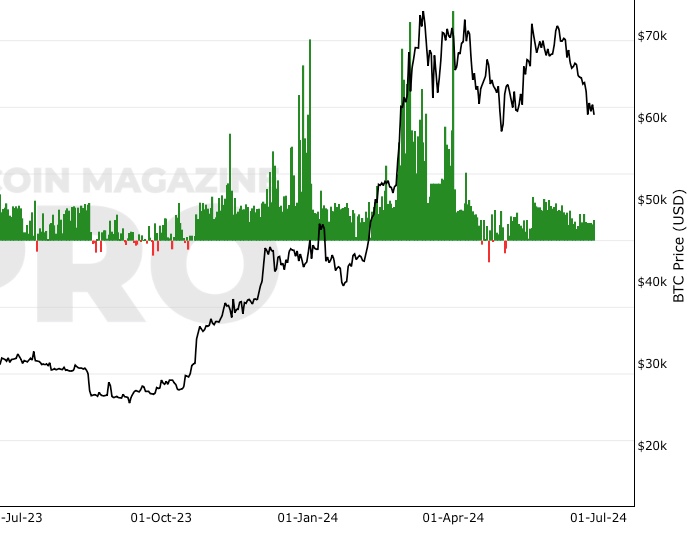
Tracking growth in global money supply from major central banks versus Bitcoin price.
More money in the global system can encourage spending on perceived ‘risk assets' such as Bitcoin. It is therefore extremely valuable for strategic investors to monitor changes in global liquidity over time in relation to Bitcoin price.
Historically, Bitcoin bull markets have coincided with the accelerated expansion of global liquidity.
M2 money supply is a measure of the total amount of currency and near money in a country’s economy. It includes cash, checking deposits, savings deposits, money market accounts, retail mutual funds, and time deposits of less than $100,000.
For an effective measurement of Global Liquidity beyond a more simple method of only tracking a number of Central Banks' M2 Money Supply, at Bitcoin Magazine Pro we also incorporate the Federal Reserve's Liabilities with other federal reserve banks and Overnight Reverse Repurchase Agreements.
Major Central Banks tracked for Global M2:
You May Also Be Interested In

Short-Term Holder Realized Price
Average price at which short-term investors have purchased their Bitcoin.

AASI (Active Address Sentiment Indicator)
Comparing change in price with change in number of addresses to determine if Bitcoin is over/undervalued in the short term.
Bitcoin Funding Rates
Perpetual contract funding rates.
Make smarter decisions about Bitcoin. Instantly.
Access the Bitcoin and Global Macro Charts that really drive Bitcoin’s price.
+40 chart alerts. Never miss critical levels on charts again.
Analysis newsletter. Manage your emotions at market extremes.
Private Tradingview indicators. See Bitcoin chart levels in real time!
Cancel anytime.
Any information on this site is not to be considered as financial advice. Please review the Disclaimer section for more information.