 Bitcoin Yearly Lows
Acercarse con la pantalla táctil: Toca y mantén con UN dedo y luego arrastra.
Acercarse al escritorio: Haz clic con el botón izquierdo y arrastra.
Reiniciar: Doble clic.
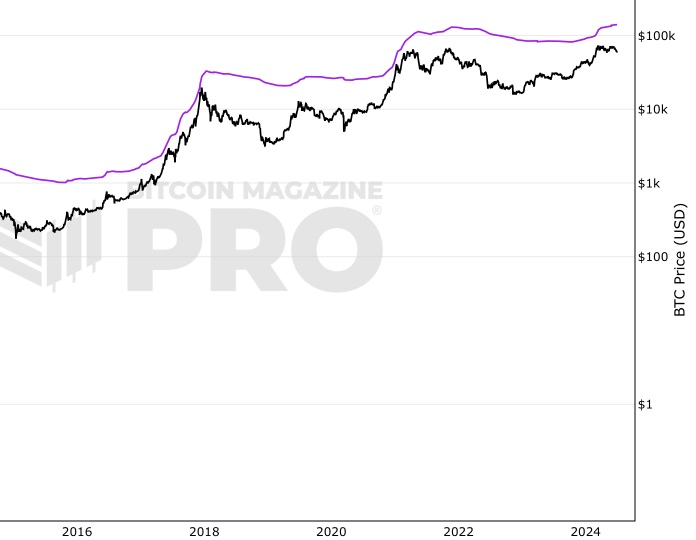
When most people follow the Bitcoin price, they focus on the all-time highs (ATHs). But a better way to understand Bitcoin’s long-term growth is by looking at the yearly low prices.
This chart tracks the annual low for Bitcoin every year since 2012, updating automatically as new data comes in. By focusing on the lowest points of each year, investors can see how even during bear markets, Bitcoin’s long-term adoption has consistently pushed its “floor price” higher over time.
Why Yearly Lows Matter
- Resilience through cycles: Even after major market corrections, Bitcoin rarely returns to its previous yearly low.
- Signal of adoption: Rising yearly lows highlight how Bitcoin’s global demand and adoption increase year after year.
- Smarter perspective: Instead of chasing tops, tracking Bitcoin price lows gives a more realistic view of long-term support and value growth.
Historical Bitcoin Price Lows
- 2012: $4
- 2013: $13
- 2015: $190
- 2018: $3,237
- 2020: $5,014
- 2021: $28,723
…and the trend continues upward as Bitcoin gains mainstream recognition.
Bitcoin Price in Perspective
Bitcoin remains volatile in the short term, but the historical yearly low trend shows why many see it as a reliable long-term store of value. As institutional investors, corporations, and individuals adopt Bitcoin, these yearly lows provide one of the clearest measures of its growing strength.
Stay tuned to this live chart to track the Bitcoin price lows as they evolve — a powerful reminder that Bitcoin’s story is not just about peaks, but about steadily rising foundations.
También puedes estar interesado en

Liquidez mundial (M2) frente al precio del Bitcoin
El gráfico de Liquidez Global muestra el crecimiento de la oferta monetaria mundial de los principales bancos centrales frente al precio del Bitcoin.
Delta Top
Modelo de precios para identificar los máximos del mercado alcista de Bitcoin.

Hashprice Volatility
30-day 60-day, 90-day volatility of Hashprice.
Tome decisiones más inteligentes sobre Bitcoin. Al instante.
Acceda a los Gráficos Macro Globales y de Bitcoin que realmente impulsan el precio de Bitcoin.
+40 alertas de gráficos. No vuelvas a perderte niveles críticos en los gráficos.
Boletín de análisis. Controle sus emociones en los extremos del mercado.
Indicadores privados de Tradingview. ¡Vea los niveles del gráfico de Bitcoin en tiempo real!
Cancela en cualquier momento.
Any information on this site is not to be considered as financial advice. Please review the Disclaimer section for more information.