 Bitcoin Yearly Highs and Lows
Acercarse con la pantalla táctil: Toca y mantén con UN dedo y luego arrastra.
Acercarse al escritorio: Haz clic con el botón izquierdo y arrastra.
Reiniciar: Doble clic.
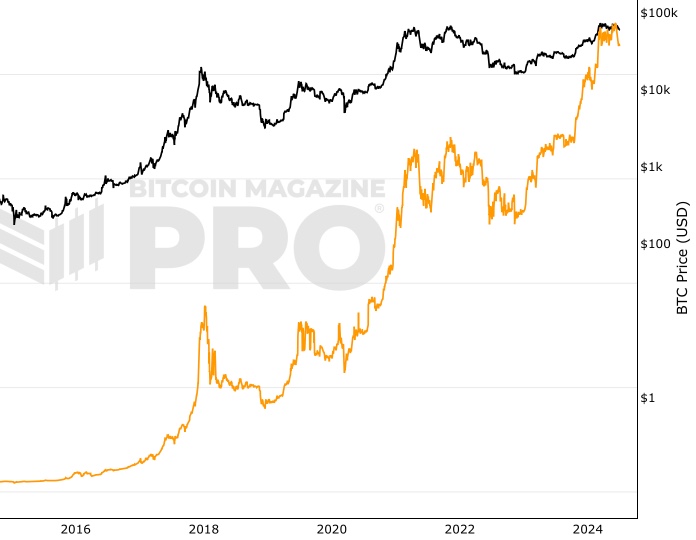
This live chart shows both the yearly highs and yearly lows for Bitcoin (BTC/USD), giving a complete picture of how Bitcoin’s price evolves year by year. Instead of focusing only on peaks or bottoms, this chart highlights the full range of Bitcoin’s performance across each year.
Why Compare Bitcoin Highs and Lows?
- Clearer perspective: Seeing highs and lows together shows the volatility and resilience of Bitcoin across bull and bear markets.
- Long-term growth: Despite deep pullbacks, Bitcoin’s yearly lows keep trending higher, while yearly highs push further into record territory.
- Investor insight: The distance between highs and lows illustrates Bitcoin’s cyclical nature — crucial for understanding risk and opportunity.
Key Insights from the Chart
- Early years (2012–2015): Bitcoin was highly volatile, but yearly lows quickly climbed from single digits into the hundreds.
- 2017 bull run: A new all-time high near $20,000, with lows still far above previous cycles.
- 2020–2021: The COVID cycle saw lows over $5,000 and highs close to $70,000, cementing Bitcoin as a mainstream asset.
- Ongoing adoption: Each cycle sets a higher floor and a higher ceiling, reflecting growing global demand.
Bitcoin Price in Context
The Bitcoin yearly high and low chart is one of the best ways to see Bitcoin’s long-term trajectory. While short-term price swings dominate headlines, the rising pattern of both highs and lows shows why many view Bitcoin as a durable, long-term store of value.
Stay updated with this live chart to track Bitcoin’s price range each year — a powerful tool for traders, investors, and researchers who want the full picture.
También puedes estar interesado en
Direcciones Con Saldo $100
Gráfico en vivo que muestra el número de direcciones únicas que poseen al menos $100.
Días de Monedas Destruidas
Número de monedas multiplicadas por los días que han pasado desde que se movieron por última vez.
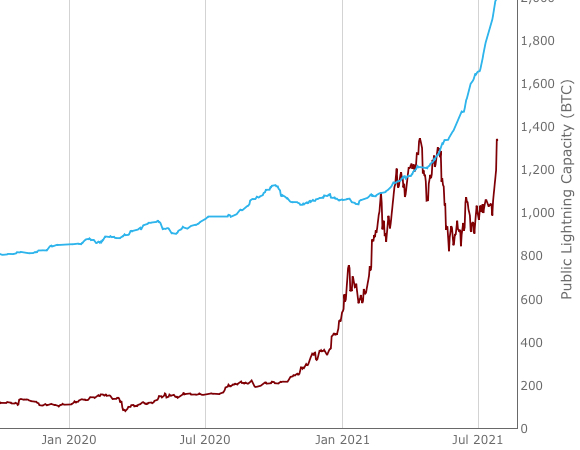
Capacidad de Bitcoin Lightning
Capacidad acumulada de todos los nodos de la “Lightning Network".
Tome decisiones más inteligentes sobre Bitcoin. Al instante.
Acceda a los Gráficos Macro Globales y de Bitcoin que realmente impulsan el precio de Bitcoin.
+40 alertas de gráficos. No vuelvas a perderte niveles críticos en los gráficos.
Boletín de análisis. Controle sus emociones en los extremos del mercado.
Indicadores privados de Tradingview. ¡Vea los niveles del gráfico de Bitcoin en tiempo real!
Cancela en cualquier momento.
Any information on this site is not to be considered as financial advice. Please review the Disclaimer section for more information.