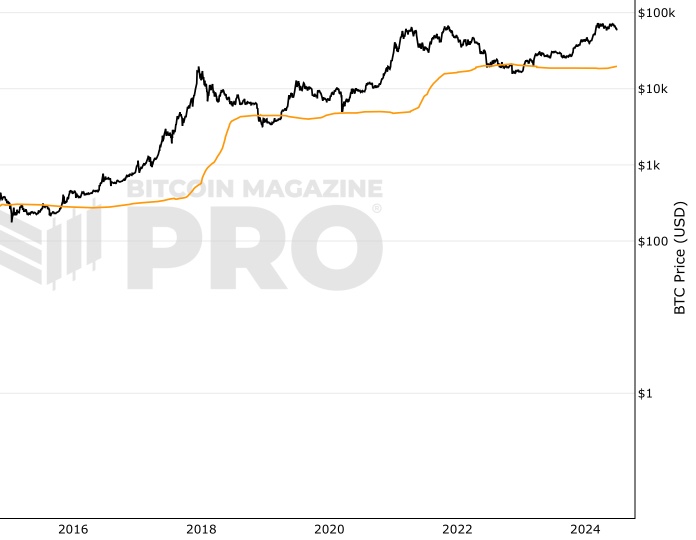
 Bitcoin Yearly Highs
Acercarse con la pantalla táctil: Toca y mantén con UN dedo y luego arrastra.
Acercarse al escritorio: Haz clic con el botón izquierdo y arrastra.
Reiniciar: Doble clic.
This chart shows the highest daily close for Bitcoin (BTC/USD) in each year, updated live as new data comes in. While short-term volatility grabs headlines, looking at the yearly highs gives a clear picture of Bitcoin’s explosive long-term growth and adoption.
Why Track Bitcoin Yearly Highs?
- All-time highs in context: Instead of focusing only on one peak, yearly highs show how Bitcoin regularly sets new records.
- Historical perspective: From single-digit prices in its early years to tens of thousands of dollars today, Bitcoin’s yearly highs highlight its journey from niche asset to global financial force.
- Investor insights: Watching the highest Bitcoin prices per year helps identify cycles of growth, consolidation, and renewed adoption.
Historical Bitcoin Yearly Highs
Some key yearly highs in Bitcoin’s history include:
- 2013: $1,147 — the first big bull run.
- 2017: $19,497 — Bitcoin enters mainstream headlines.
- 2021: $68,789 — the peak of a major adoption cycle.
Each new high demonstrates how Bitcoin has continued to outperform traditional assets over the long run.
Bitcoin Price in Perspective
The Bitcoin yearly high chart makes it easy to compare past bull markets with today’s trends. It also shows that while Bitcoin can experience deep pullbacks, its record highs keep pushing upward over time.
For traders, investors, and researchers, this chart provides a live snapshot of Bitcoin’s growth story, one peak at a time.
También puedes estar interesado en

Direcciones Con Saldo $10
Gráfico en vivo que muestra el número de direcciones únicas que poseen al menos $10.
Long-Term Holder Realized Price
Average price at which long-term investors have purchased their Bitcoin.

Active Bitcoin Treasury Companies
Bitcoin treasury holdings for Bitcoin Strategy companies.
Tome decisiones más inteligentes sobre Bitcoin. Al instante.
Acceda a los Gráficos Macro Globales y de Bitcoin que realmente impulsan el precio de Bitcoin.
+40 alertas de gráficos. No vuelvas a perderte niveles críticos en los gráficos.
Boletín de análisis. Controle sus emociones en los extremos del mercado.
Indicadores privados de Tradingview. ¡Vea los niveles del gráfico de Bitcoin en tiempo real!
Cancela en cualquier momento.
Any information on this site is not to be considered as financial advice. Please review the Disclaimer section for more information.