 Bitcoin: Key Moving Averages
Acercarse con la pantalla táctil: Toca y mantén con UN dedo y luego arrastra.
Acercarse al escritorio: Haz clic con el botón izquierdo y arrastra.
Reiniciar: Doble clic.
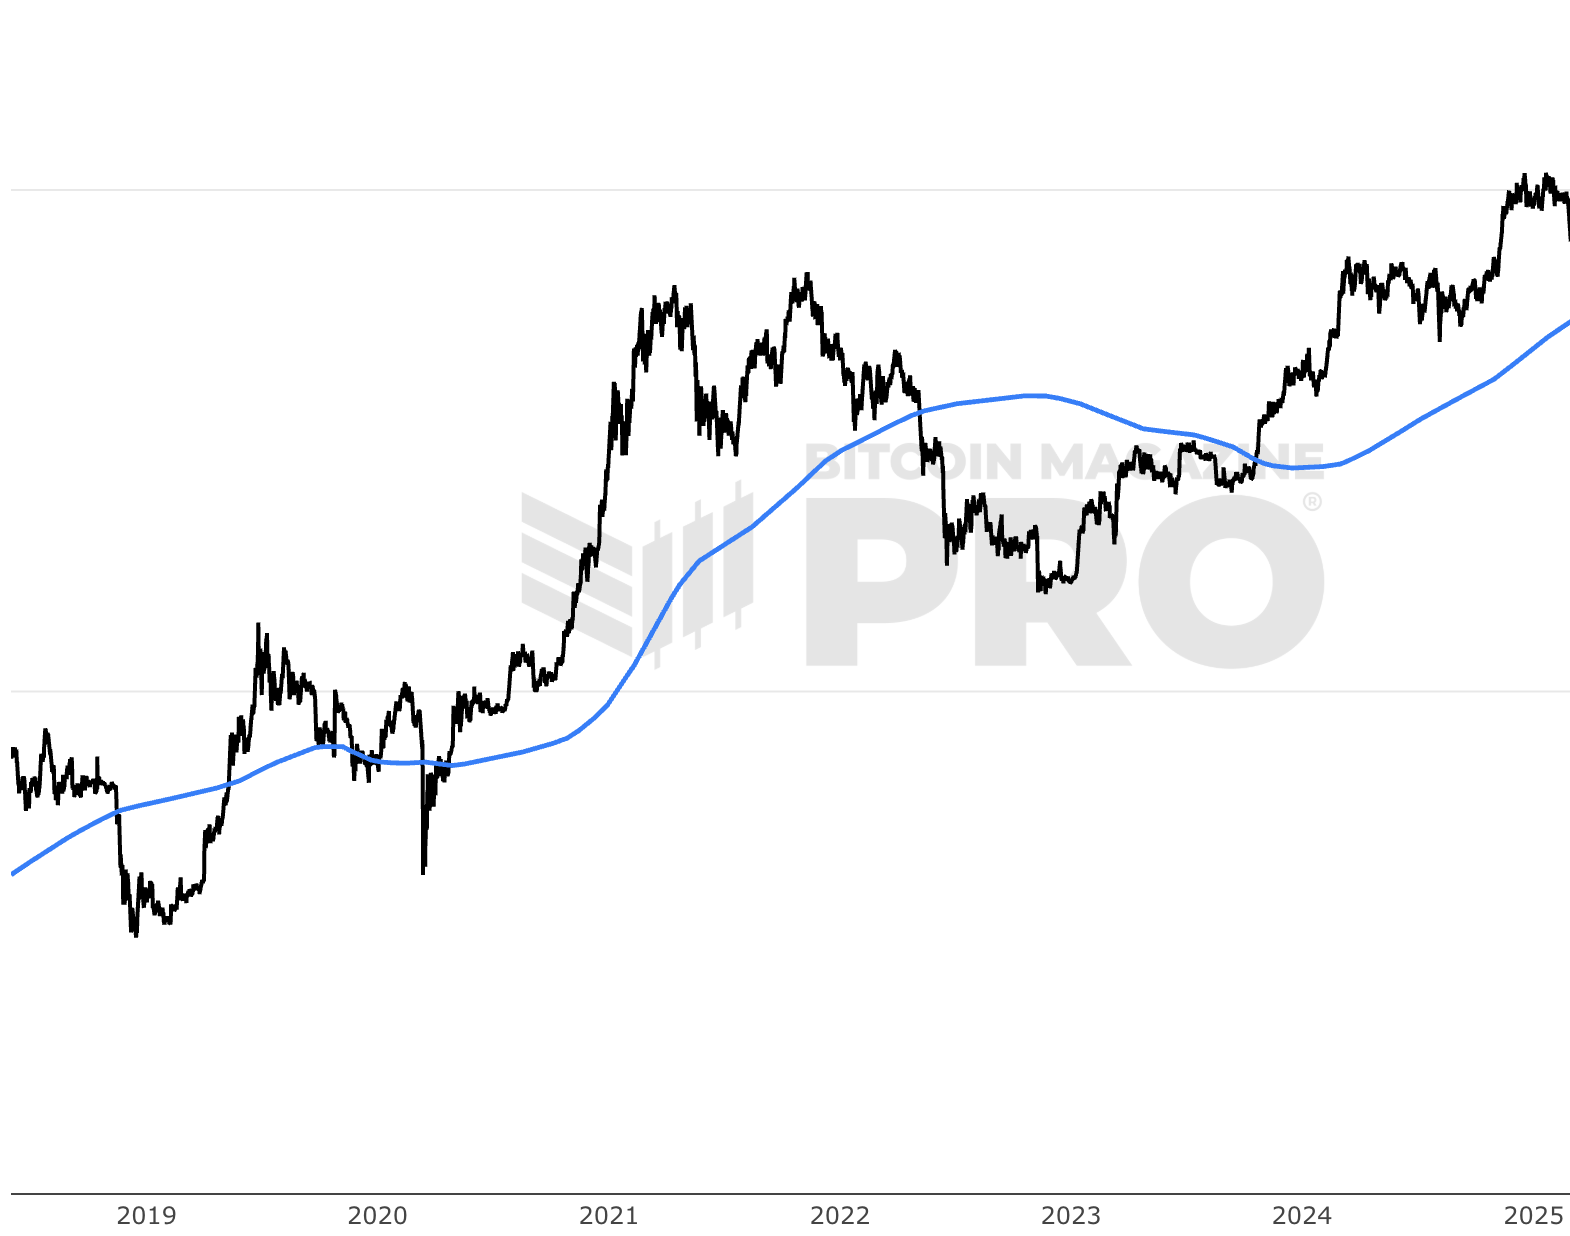
Bitcoin Key Moving Averages
Bitcoin’s price trends become clearer when viewed through multiple moving averages rather than a single timeframe. The Bitcoin Key Moving Averages chart combines several widely followed indicators into one view, helping investors and traders understand where Bitcoin sits within the broader market structure.
What Are Bitcoin’s Key Moving Averages?
Moving averages smooth price data over time, reducing noise and highlighting underlying trends. Different timeframes capture different aspects of market behaviour, from short-term momentum to long-term cycle structure.
Short-Term Moving Averages
Short-term moving averages, such as the 50 day moving average, respond quickly to changes in price. They are commonly used to track momentum, identify pullbacks, and assess whether short-term trend conditions remain intact.
Medium-Term Moving Averages
Medium-term averages, including the 200 day moving average and weekly-based averages, help define broader trend direction. They are often used as reference points for support and resistance during corrections and trend transitions.
Long-Term Cycle Moving Averages
Longer-term indicators such as the 365 day moving average, 100 week moving average, and 200 week moving average provide insight into Bitcoin’s macro cycle. These levels have historically aligned with periods of long-term accumulation, market stress, or cycle resets.
Why Viewing Multiple Moving Averages Matters
No single moving average tells the full story. Viewing multiple timeframes together helps identify areas of confluence where several averages align, often marking important zones of support, resistance, or trend confirmation.
Using the Bitcoin Key Moving Averages Chart
The live chart above allows you to compare Bitcoin’s price against its most important moving averages in one place. This combined view helps reduce overreaction to short-term price moves and supports more informed decision-making.
Explore Individual Moving Averages
For deeper analysis, each moving average can also be explored individually, allowing you to focus on specific timeframes while keeping the broader market context in mind.
También puedes estar interesado en

Bitcoin: 50 Day Moving Average
The Bitcoin 50 day moving average is a widely watched indicator used to assess trend direction and market momentum.

Bitcoin: 50 Week Moving Average
The Bitcoin 50 week moving average is a widely watched indicator used to assess trend direction and market momentum.
Bitcoin: 100 Week Moving Average
The Bitcoin 100 week moving average is a widely watched indicator used to assess trend direction and market momentum.
Tome decisiones más inteligentes sobre Bitcoin. Al instante.
Acceda a los Gráficos Macro Globales y de Bitcoin que realmente impulsan el precio de Bitcoin.
+40 alertas de gráficos. No vuelvas a perderte niveles críticos en los gráficos.
Boletín de análisis. Controle sus emociones en los extremos del mercado.
Indicadores privados de Tradingview. ¡Vea los niveles del gráfico de Bitcoin en tiempo real!
Cancela en cualquier momento.
Any information on this site is not to be considered as financial advice. Please review the Disclaimer section for more information.