The Macro Signal That Could Kickstart The Bitcoin Bull Market
17 de julio de 2026
Author: Matt - Director of Research & Analytics
Bitcoin had one of its strongest 24-hour moves in what feels like too long, rebounding sharply off the recent lows. The catalyst was a CPI figure that came in below expectations. Everyone was braced for inflation to keep running hot, but instead it undershot, and the markets repriced almost instantly.
This week, I’m walking through why the official numbers were likely to come in soft, what the knock-on chain from inflation to liquidity to Bitcoin actually looks like, and the two risks that could still derail the recovery.
If you’re in a hurry:
- Bitcoin rebounded sharply after CPI came in below expectations, easing fears of further monetary tightening.
- The implied probability of rates holding steady jumped from under 60% to the mid-80s almost instantly, while rate hike odds collapsed from over 35% to single digits.
- Truflation, an alternative real-time inflation measure that leads official prints by roughly 45 days, has inflation running closer to 2%.
- Global M2 on a year-on-year basis may have set a low.
- The two key risks are an oil-driven inflation resurgence from Middle East escalation and the US Dollar Index sitting at a major turning point.
The Reaction
When CPI runs hot, the Federal Reserve leans toward higher rates to discourage spending, liquidity tightens, and risk assets struggle. When inflation cools, that entire chain reverses. Across the past decade, periods of rapidly rising CPI have consistently coincided with Bitcoin weakness, and declining inflation with more favorable conditions. That's why a single below-expectations print moved markets as much as it did. The reaction wasn't really about one month of data, but it was about what that data implies for the path of rates and liquidity from here.
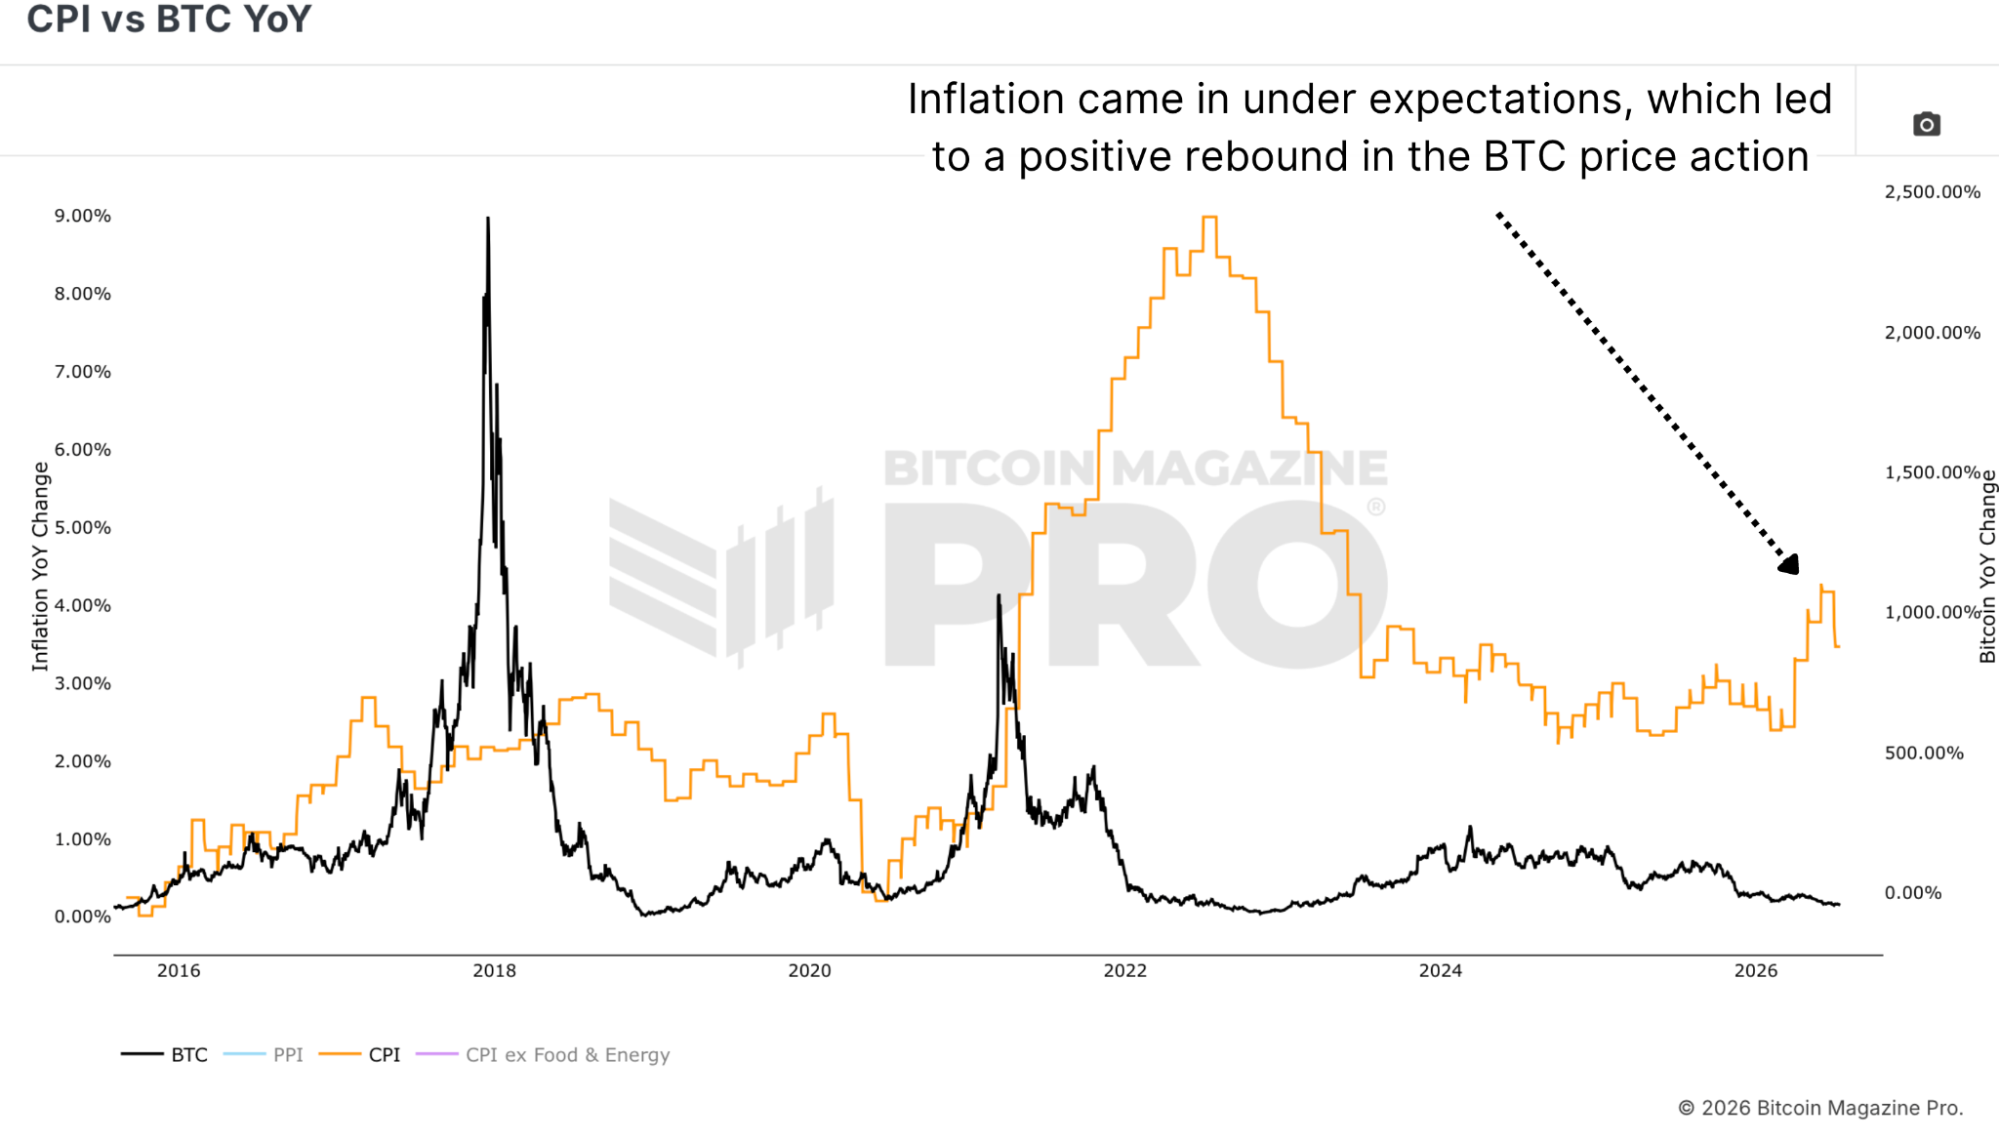
Figure 1: The CPI landed below expectations, and BTC rebounded alongside it.
Before the print, the implied probability of the Fed holding rates steady had drifted down to under 60%, with the odds of a further 25 basis point hike climbing above 35%. Within moments of the release, the hold probability jumped to the mid-80s, and hike odds collapsed to single digits.
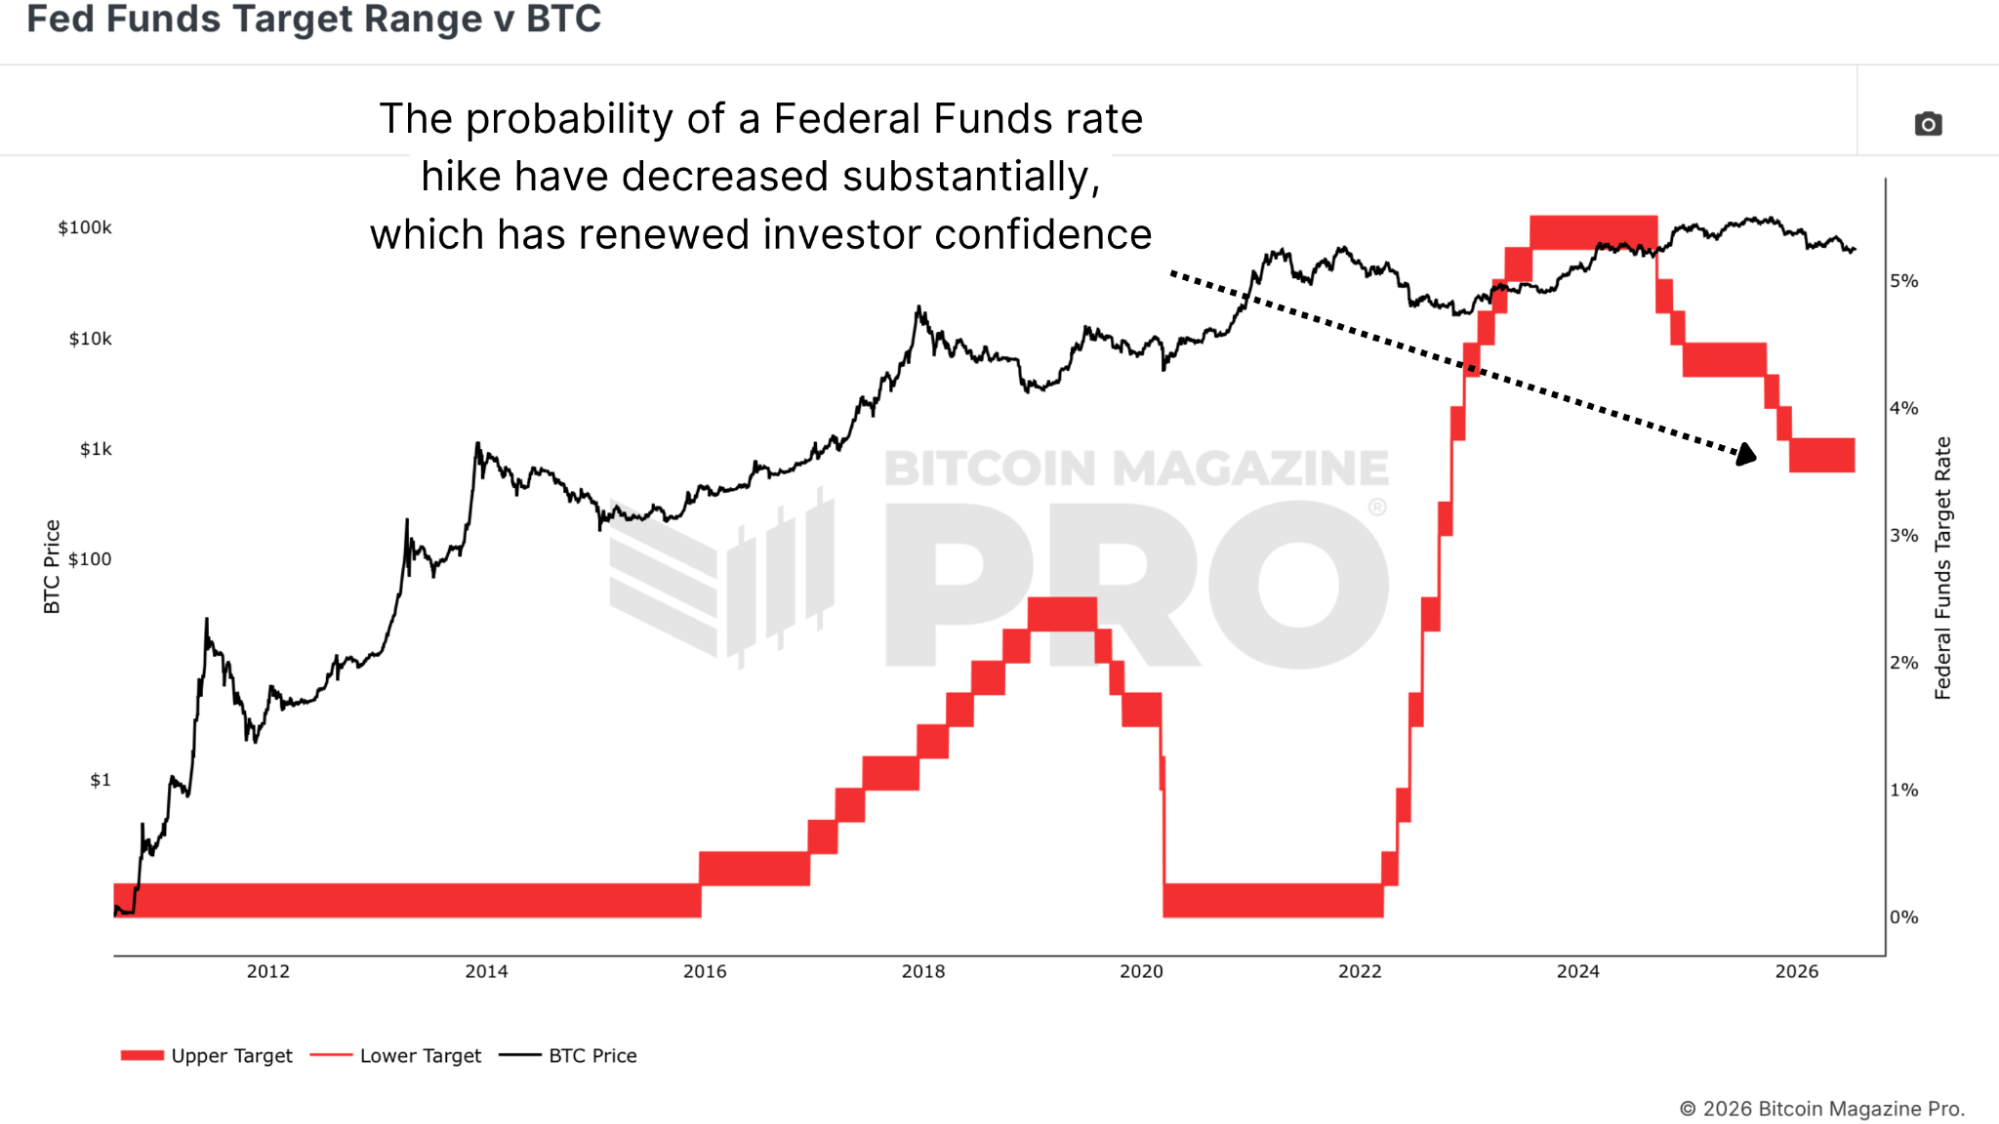
Figure 2: The Fed Funds Target Range has settled near 4%.
Liquidity Chain
Declining CPI and Global M2 are strongly inversely correlated. As inflation falls, central banks loosen, and the global supply of money and cash equivalents expands. And Global M2, particularly on a year-on-year basis with a roughly 10-week offset, has been one of the most consistent leading indicators for Bitcoin's price across its entire history.
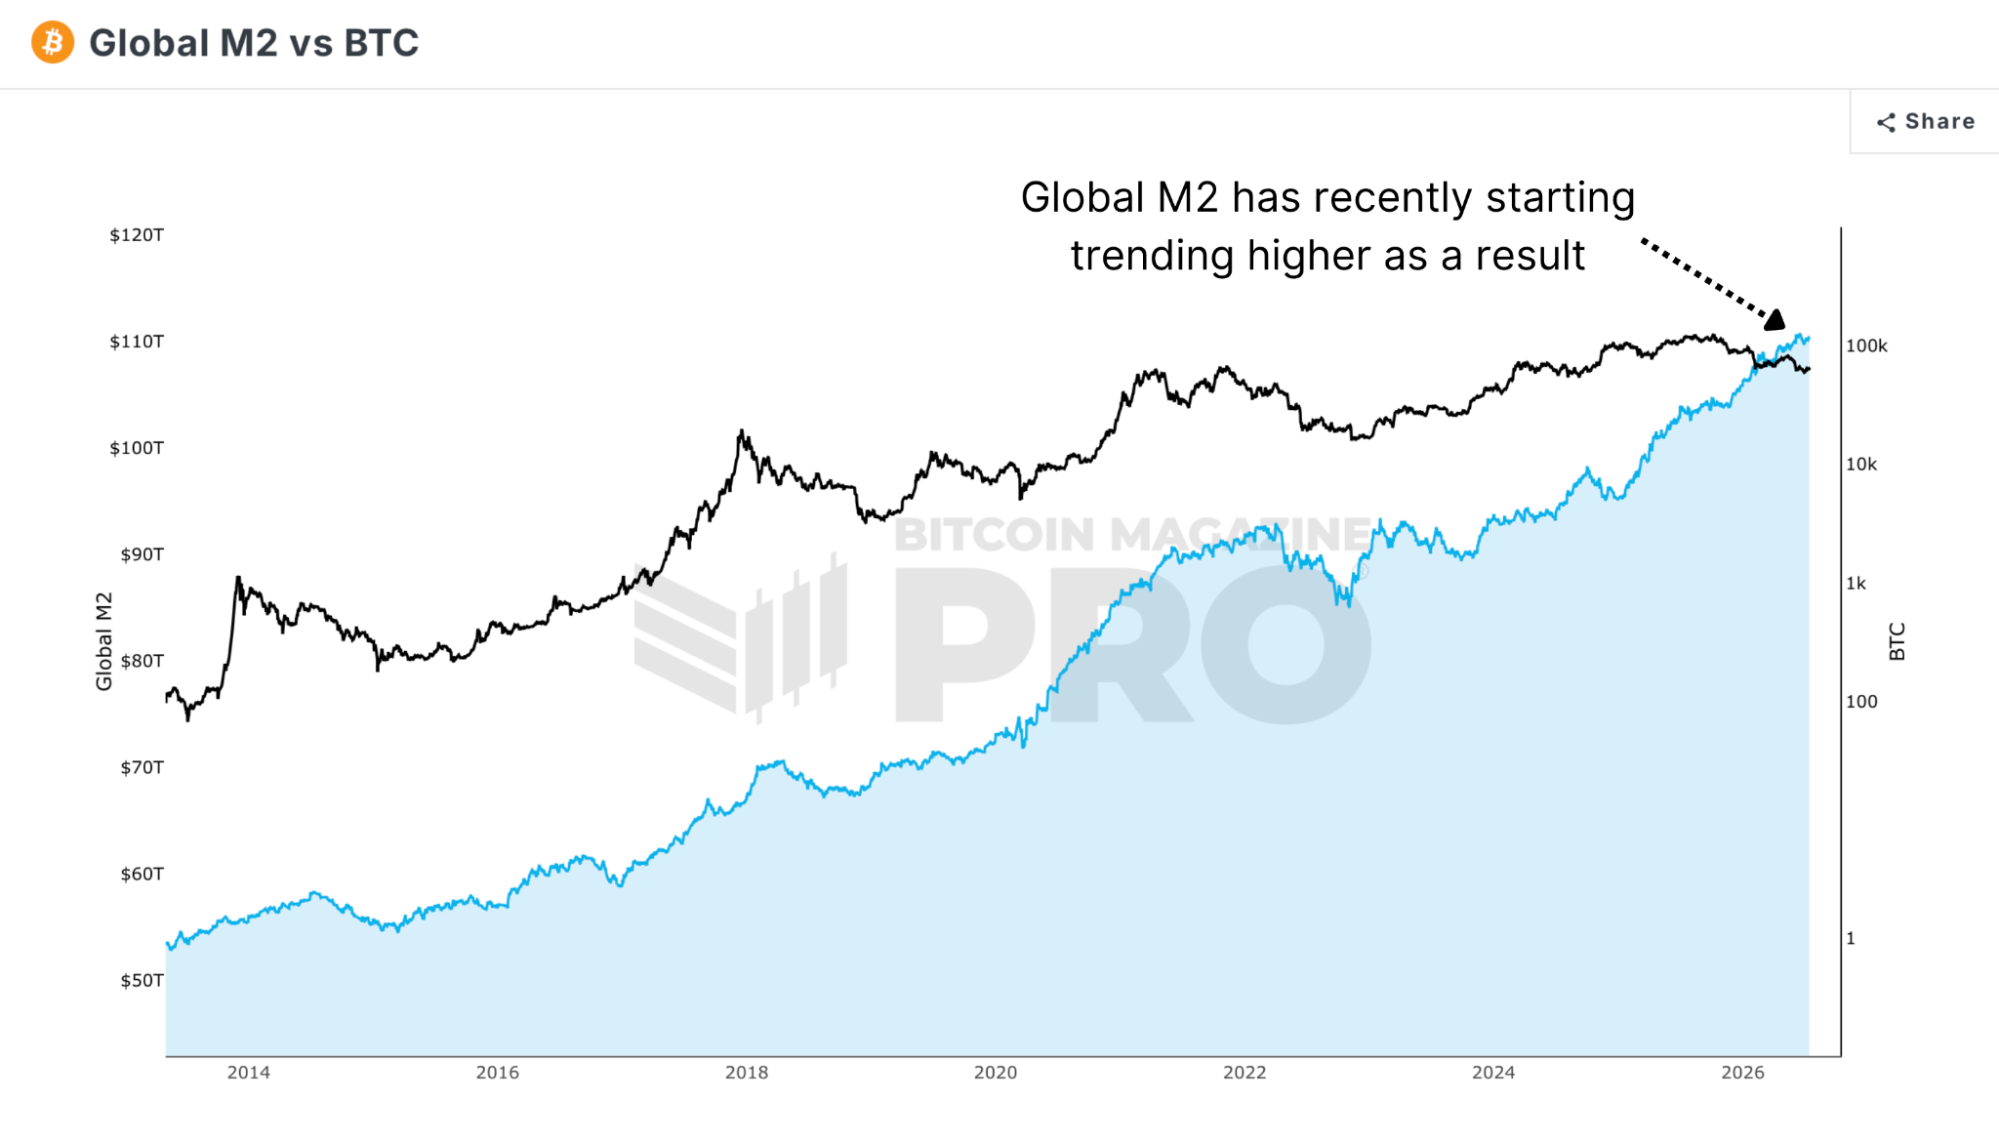
Figure 3: Global M2 is trending higher.
Right now, Global M2 year-on-year sits close to where it bottomed a few months ago and is showing early signs of renewed momentum. What's especially worth noting is the sequencing from the last cycle, where Bitcoin bottomed on November 21st, 2022, and Global M2 didn't turn higher for another 55 days or so. Bitcoin was already up 30 to 40% before the liquidity data confirmed anything.
Oil
The most credible threat to the cooling inflation story is energy. Oil recently spiked following renewed escalation in the Middle East, and because energy weighs so heavily in the official inflation basket, a sustained move higher in crude would feed directly back into hotter prints and undo the repricing we've just seen. Prediction market odds of shipping traffic through the region normalizing this month have collapsed from above 60% to essentially nothing, which tells you how quickly the situation has deteriorated.
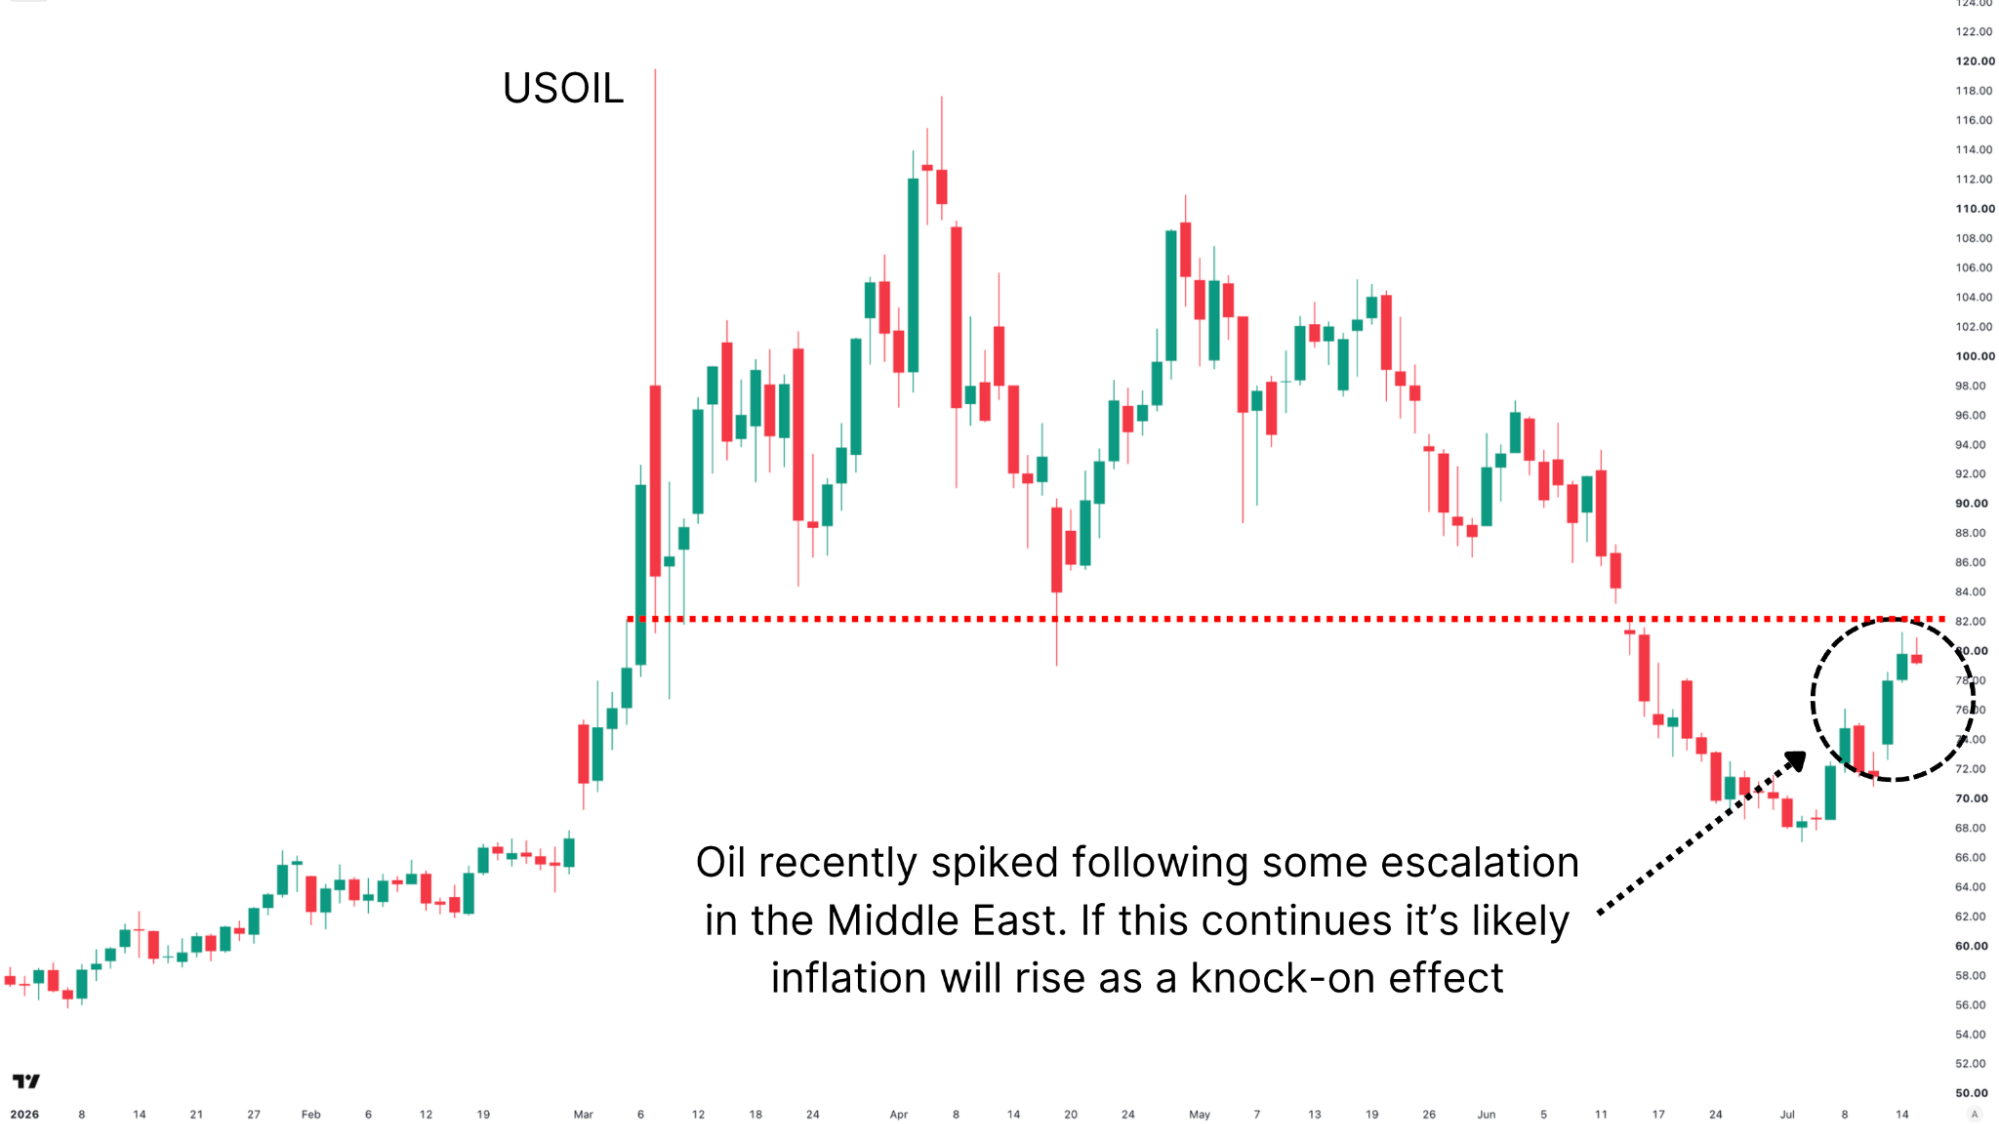
Figure 4: USOIL has bounced off recent lows, back near $80.
This is also where the downside scenario lives. If escalation accelerates, it could play the role the FTX collapse played in 2022, with one final external shock flushing price lower even after the organic capitulation is complete. In that scenario, the confluence zone around $50,000, where the Realized Price, the Long-Term Holder Realized Price, and the CVDD are converging, becomes the target.
The Dollar
The US Dollar Index was recently rejected from a major resistance zone and is currently battling its 100-week moving average. The inverse correlation between the dollar and Bitcoin is one of the strongest macro relationships in this market, and the dollar's year-on-year trend is in turn tightly linked to Global M2 itself.
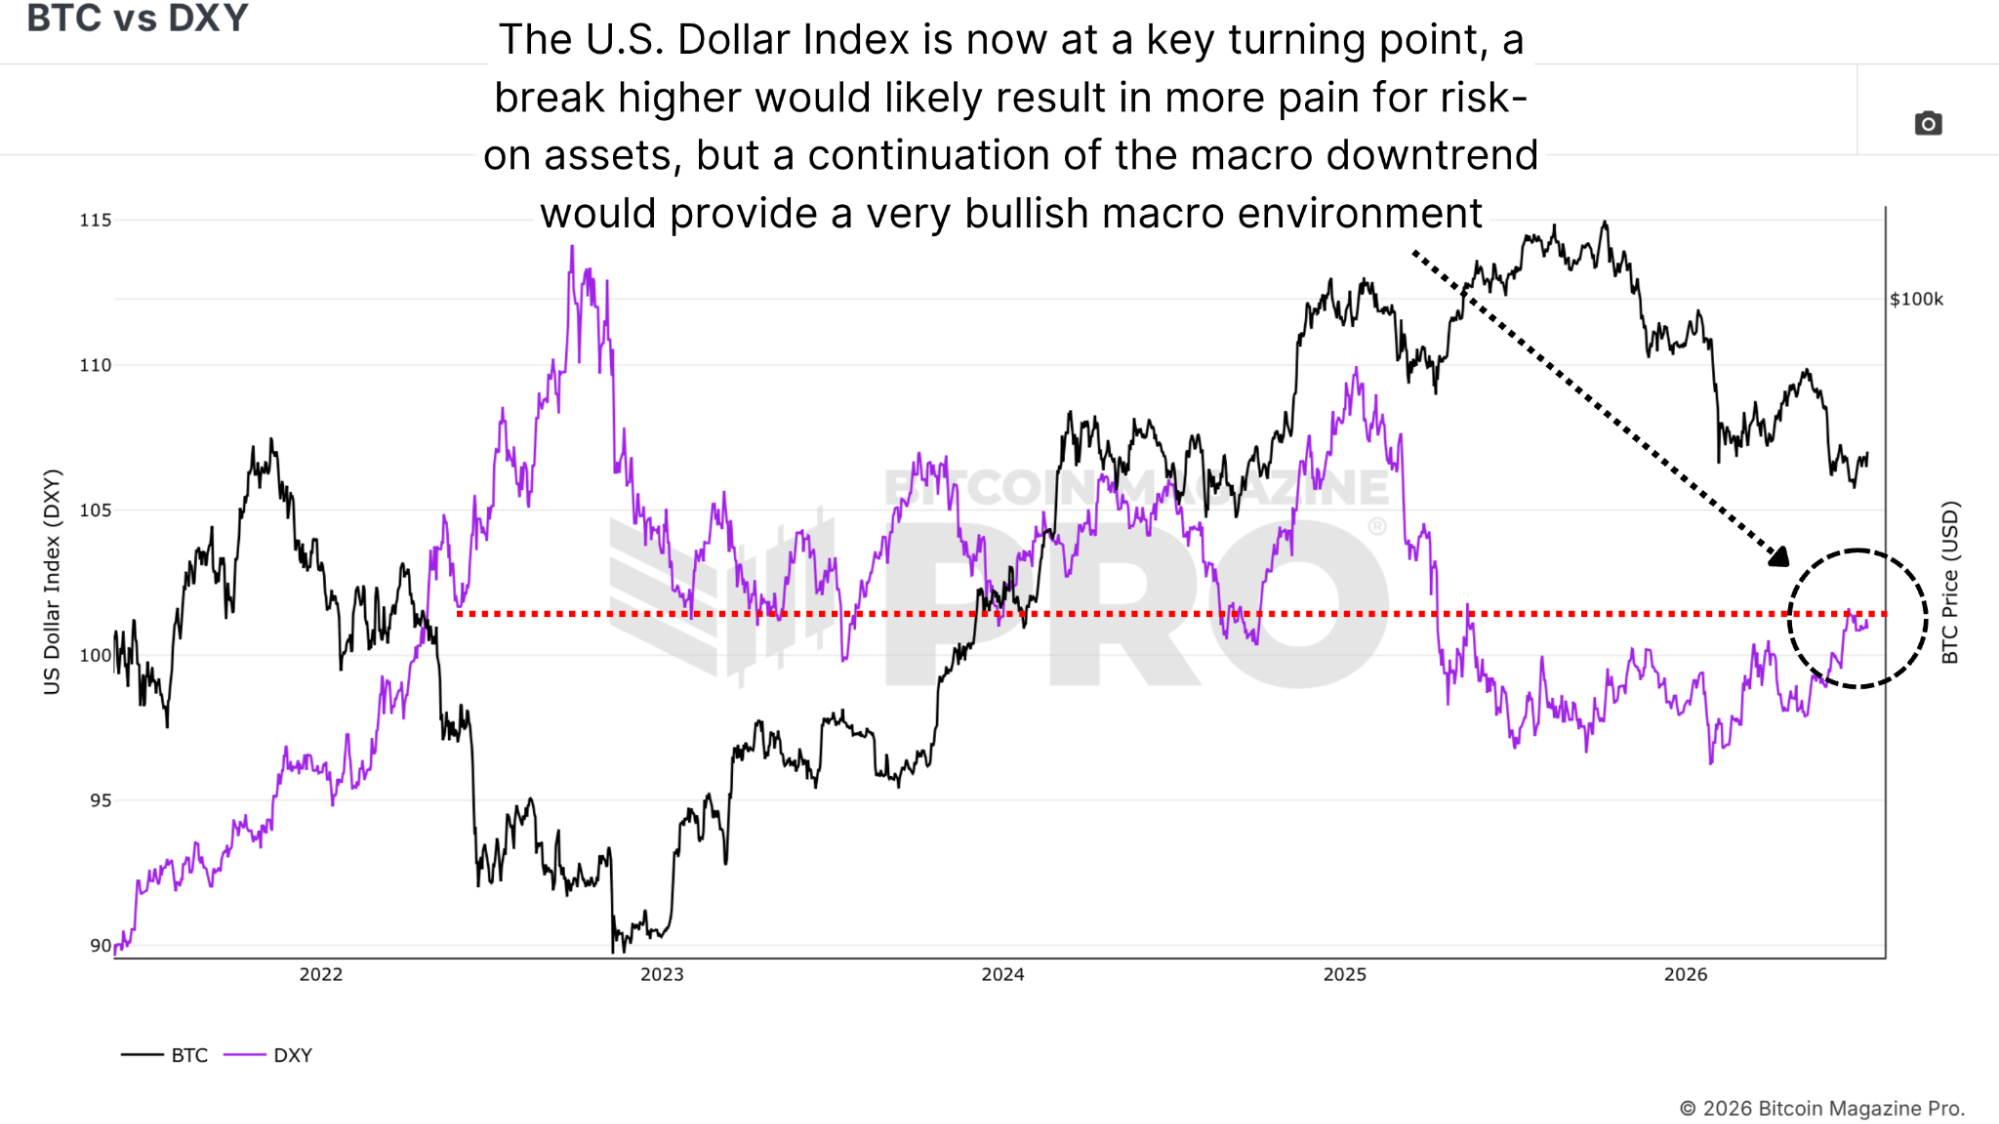
Figure 5: The DXY is battling resistance and stands at a crossroads.
A decisive break higher in the dollar would mean more pain for risk-on assets across the board. A continuation of the multi-year downtrend from here, beneath that 100-week average, would provide one of the most supportive macro backdrops Bitcoin has had in a long time.
Pulling It Together
Leading inflation data suggests the official numbers have further to fall, rate expectations have already swung decisively away from further tightening, global liquidity looks to be turning, and Bitcoin's own low is aging in a way that closely mirrors how it led the macro turn last cycle.
An oil-driven inflation resurgence or a dollar breakout would delay everything, and a severe escalation could yet deliver a final flush toward the low $50,000s. But fundamentals, technicals, timing, and macro are all starting to lean the same way, and that's not something this market has been able to say for most of the past year.
Watch our most recent YouTube video here:
The Catalyst That Kickstarts The Bitcoin Bull Market
Matt Crosby (@MattCrosbyPro)
Director of Research & Analytics
La información contenida en este sitio no debe considerarse asesoramiento financiero. Por favor revise la Descargo de responsabilidad para más información.