Bitcoin's Downside Momentum Is Running Out
3 de julio de 2026
Author: Matt - Director of Research & Analytics
Bitcoin bear markets are made up of two distinct phases. There's price-based capitulation, the big, obvious sell-off that shocks everyone. And there's time-based capitulation, the slower, quieter grind that bores and demoralises holders until sentiment finally exhausts itself. This week, I want to look at where we sit on both, because a growing stack of signals is pointing toward downside momentum genuinely running out of steam.
TL;DR:
- The previous bear market took approximately 156 days from the initial price capitulation to the final low.
- The current market is only around 10 days from replicating that window.
- The Crosby Ratio has hit one of its lowest readings ever on both the daily and weekly timeframes.
- The daily RSI has set a reading matched only by the 2018 bear market low.
- The 50-week and 100-week moving averages are due to cross imminently.
- The Active Address Sentiment Indicator has crossed back above its lower band, historically a reliable early accumulation signal.
Momentum
The Bitcoin Crosby Ratio dropped to one of its lowest readings ever as Bitcoin moved below $60,000 for the second time. The only comparable instance historically was the exact 2018 bear market low. Critically, this reading is now extreme not just on the daily timeframe but on the weekly as well, and every prior weekly instance has aligned closely with a major cycle bottom.
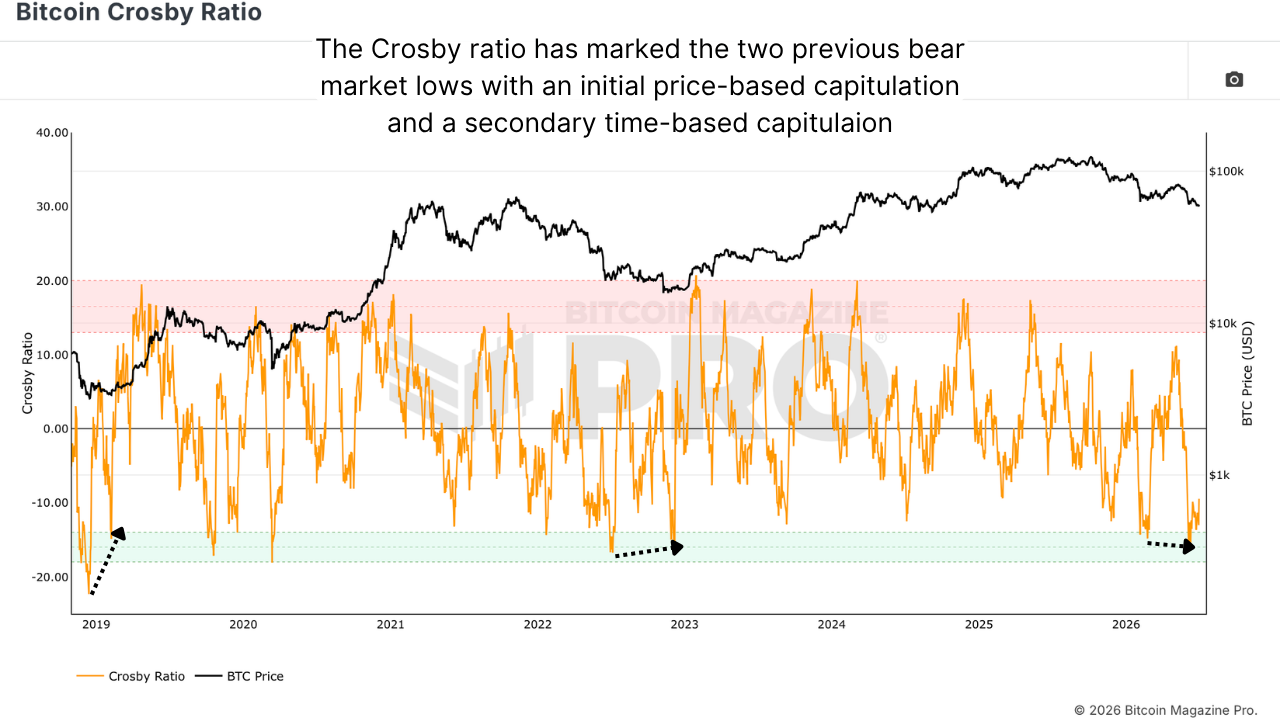
Figure 1: The Crosby Ratio exhibits a pattern previously seen at major cycle bottoms.
The RSI tells a similar story. As price returned to the $60,000 area, the daily RSI set one of the lowest readings on record, matched only by the 2018 low.
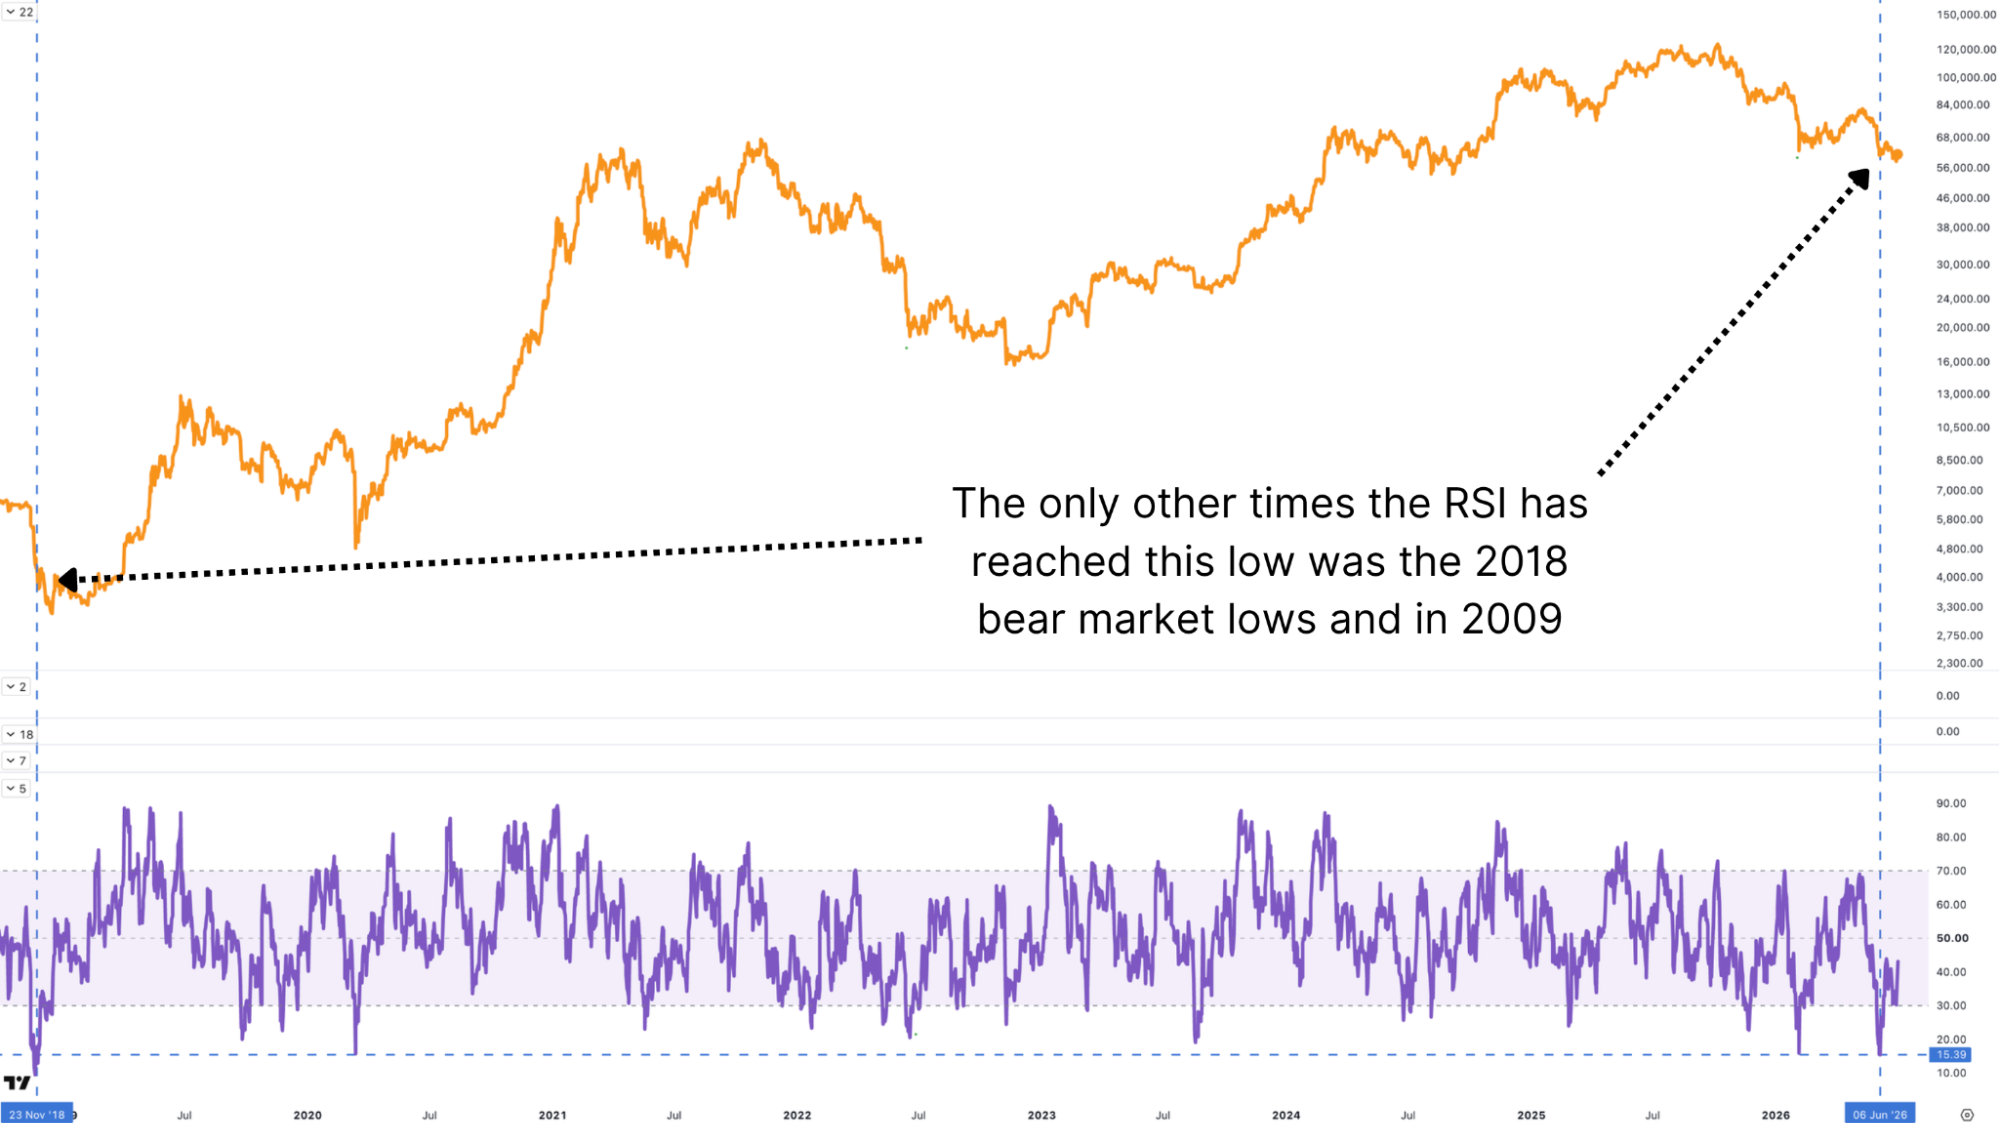
Figure 2: Weekly RSI shows a bullish divergence against price.
Time
The 50-week and 100-week moving averages are on track to produce a cross in the coming days. Looking at previous instances of this signal, the track record is notable. In 2015, it appeared with Bitcoin around $200, before the eventual run to $20,000. Near the end of the 2018-2019 bear market, it appeared with price below $4,000, ahead of the move to $69,000. In 2022, it didn't mark the exact low, but it appeared with Bitcoin around $19,000 before the climb to $126,000.
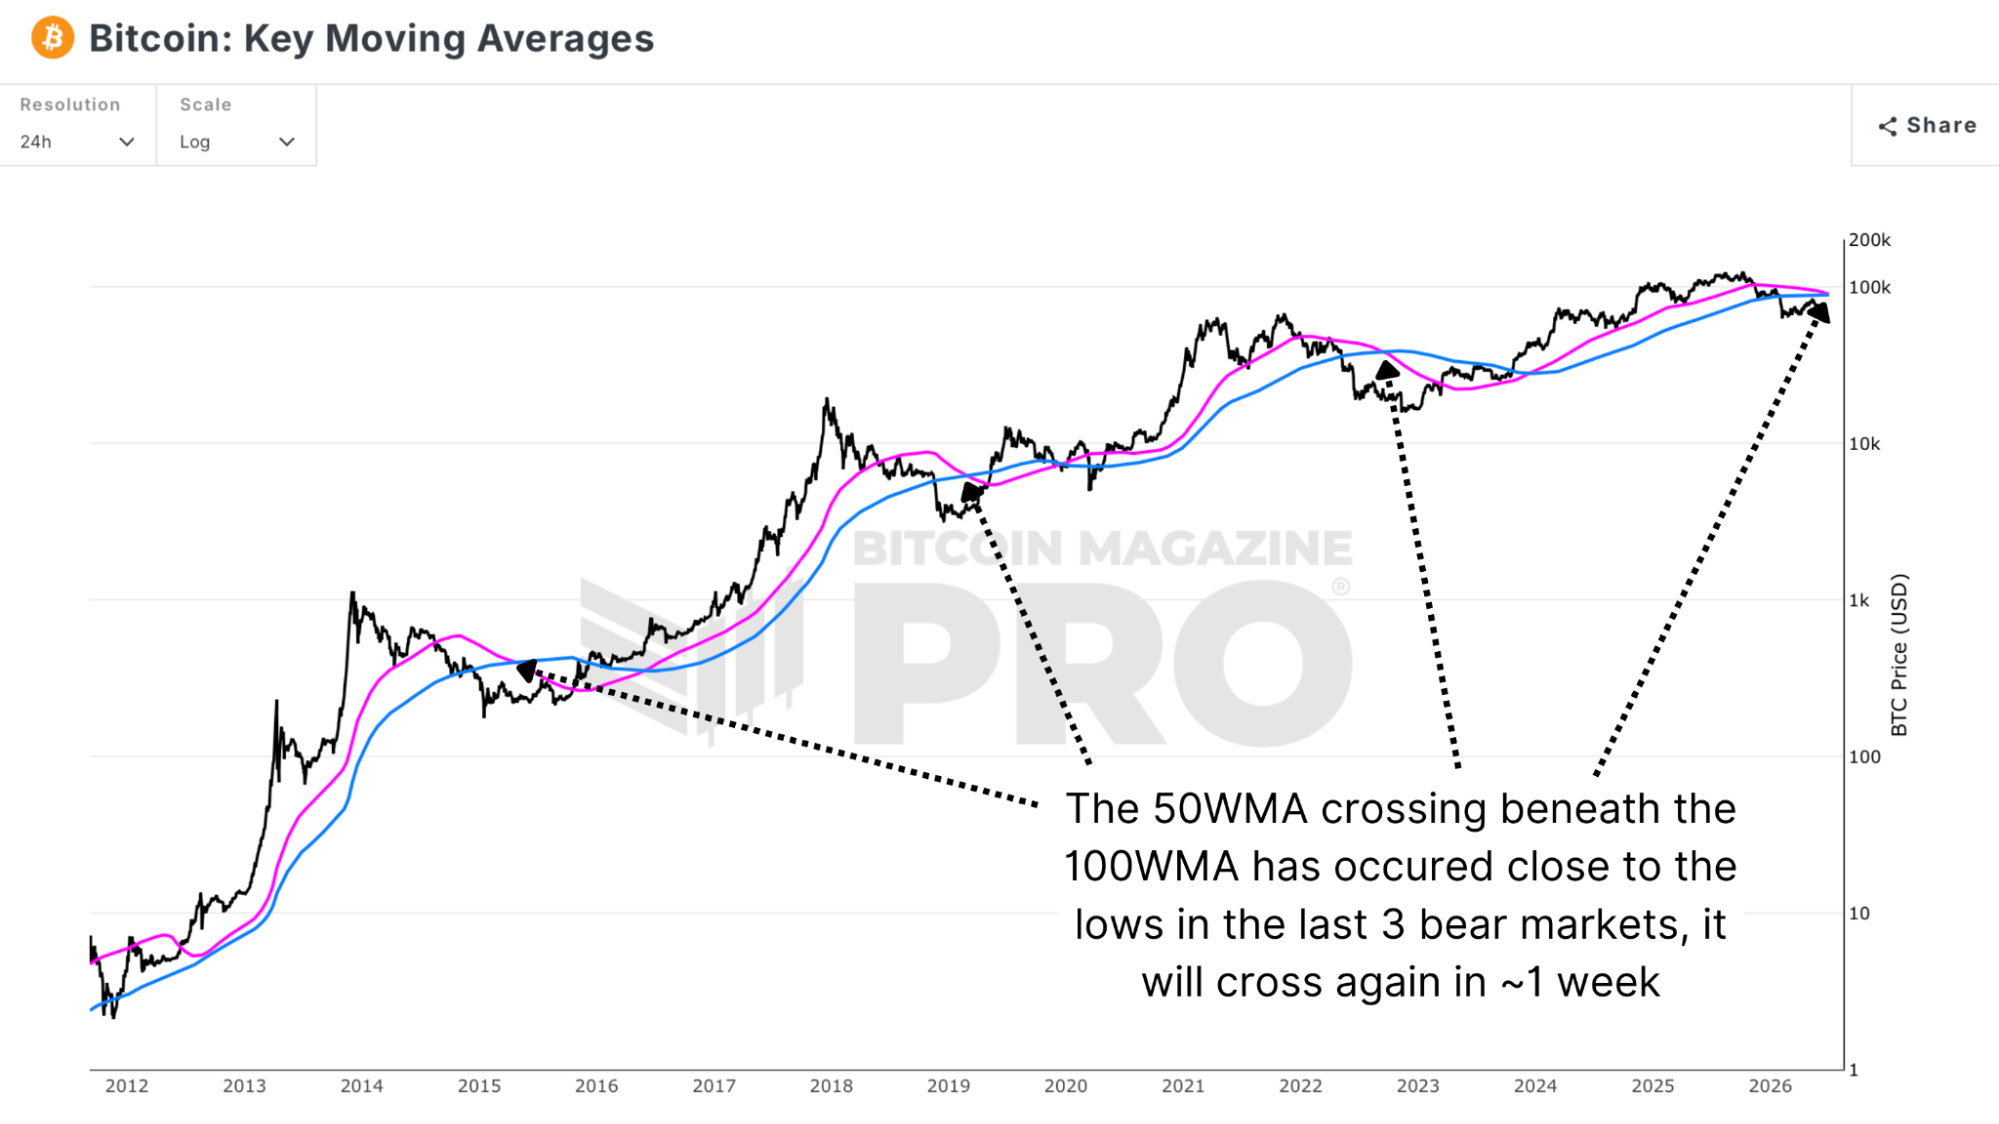
Figure 3: 50WMA and 100WMA crosses have aligned close to the last three cycle lows.
The crossing of the moving averages points to around July 10th. Along with that, a 156-day fractal from the initial capitulation to the ultimate low in the previous bear market, overlaid onto the current price action, points to around July 12th as a potential low this time around.
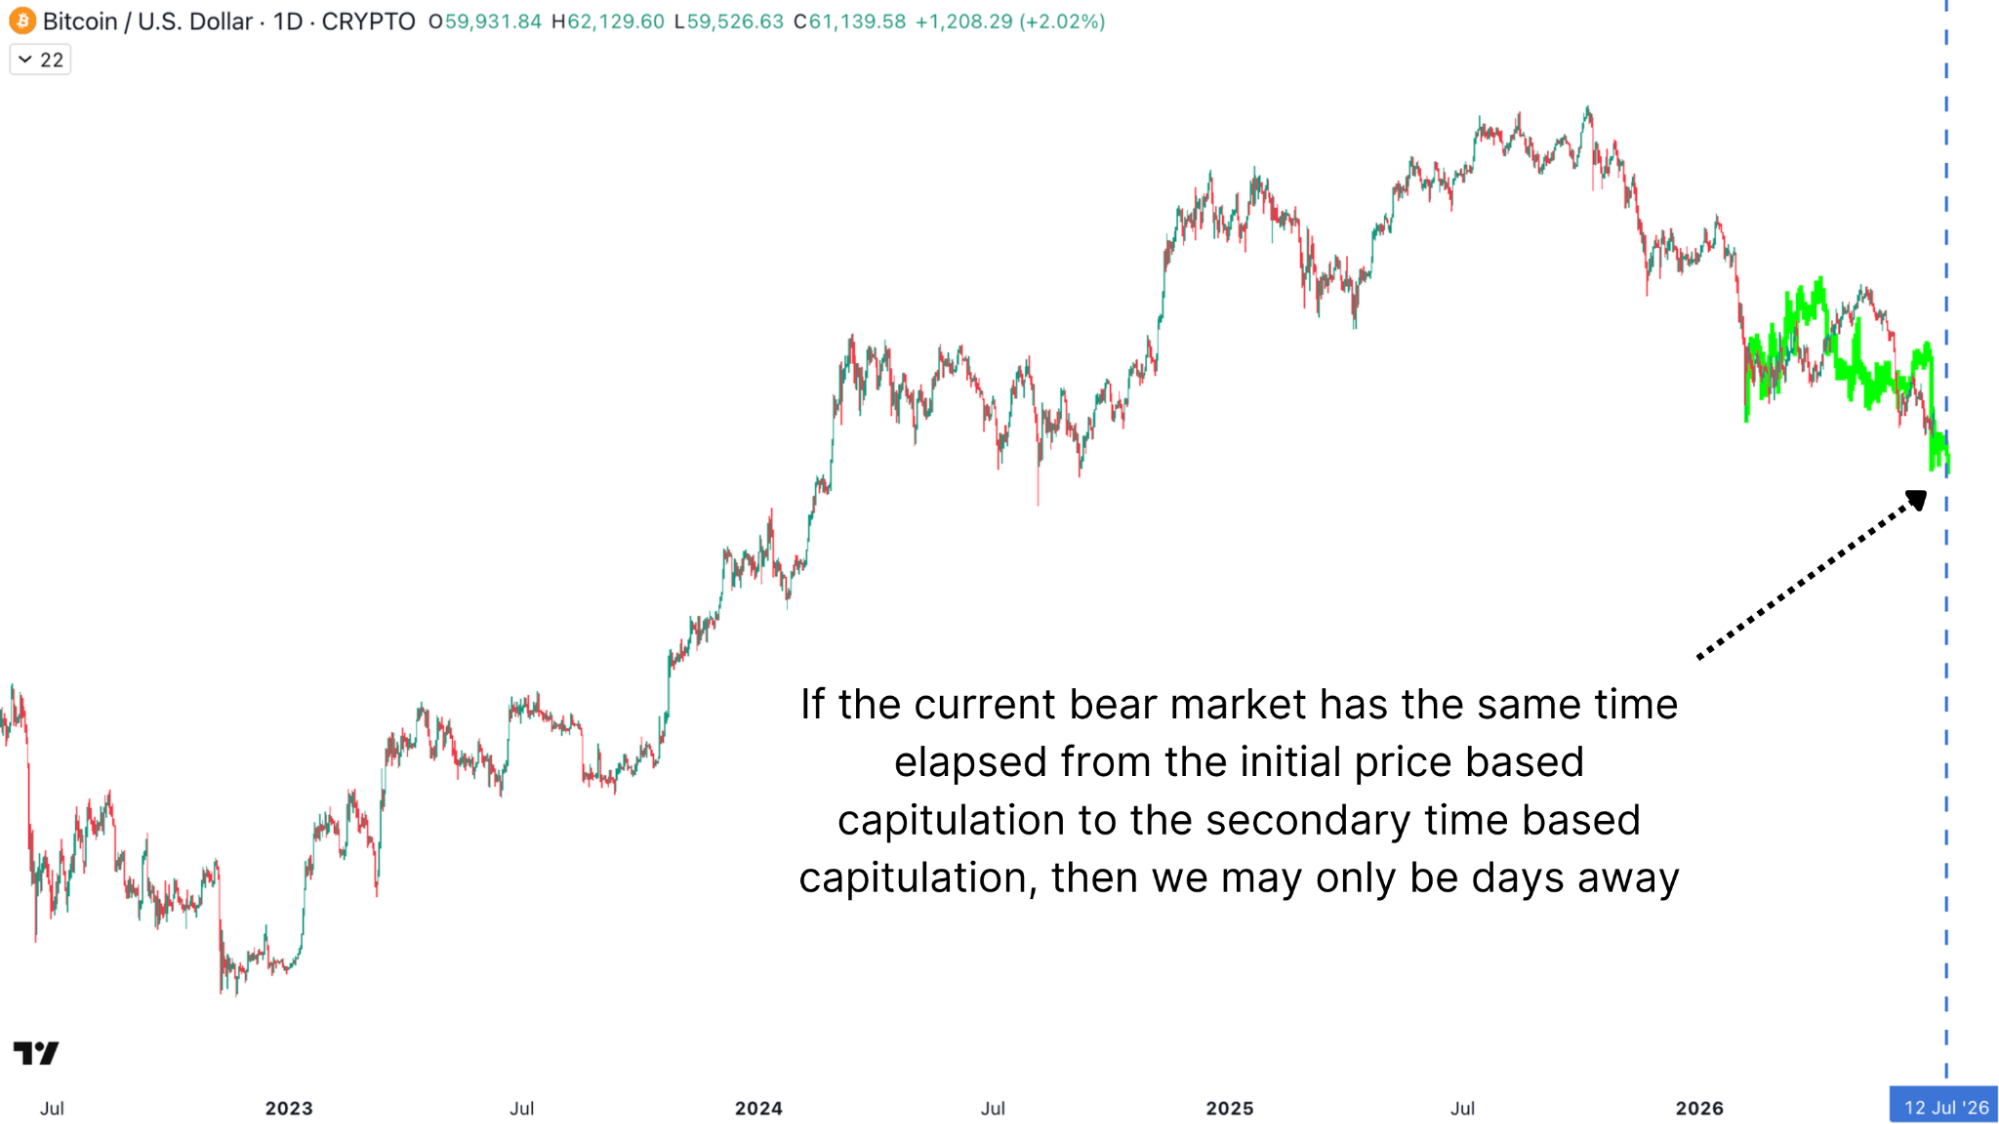
Figure 4: The BTC/USD daily chart with a 156-day fractal overlay from the previous cycle.
Network Activity
One telltale sign of a bear market is declining network usage. The Active Address Sentiment Indicator has recently shown renewed positive price momentum that's actually being supported by increased on-chain utilisation, rather than price moving in isolation.
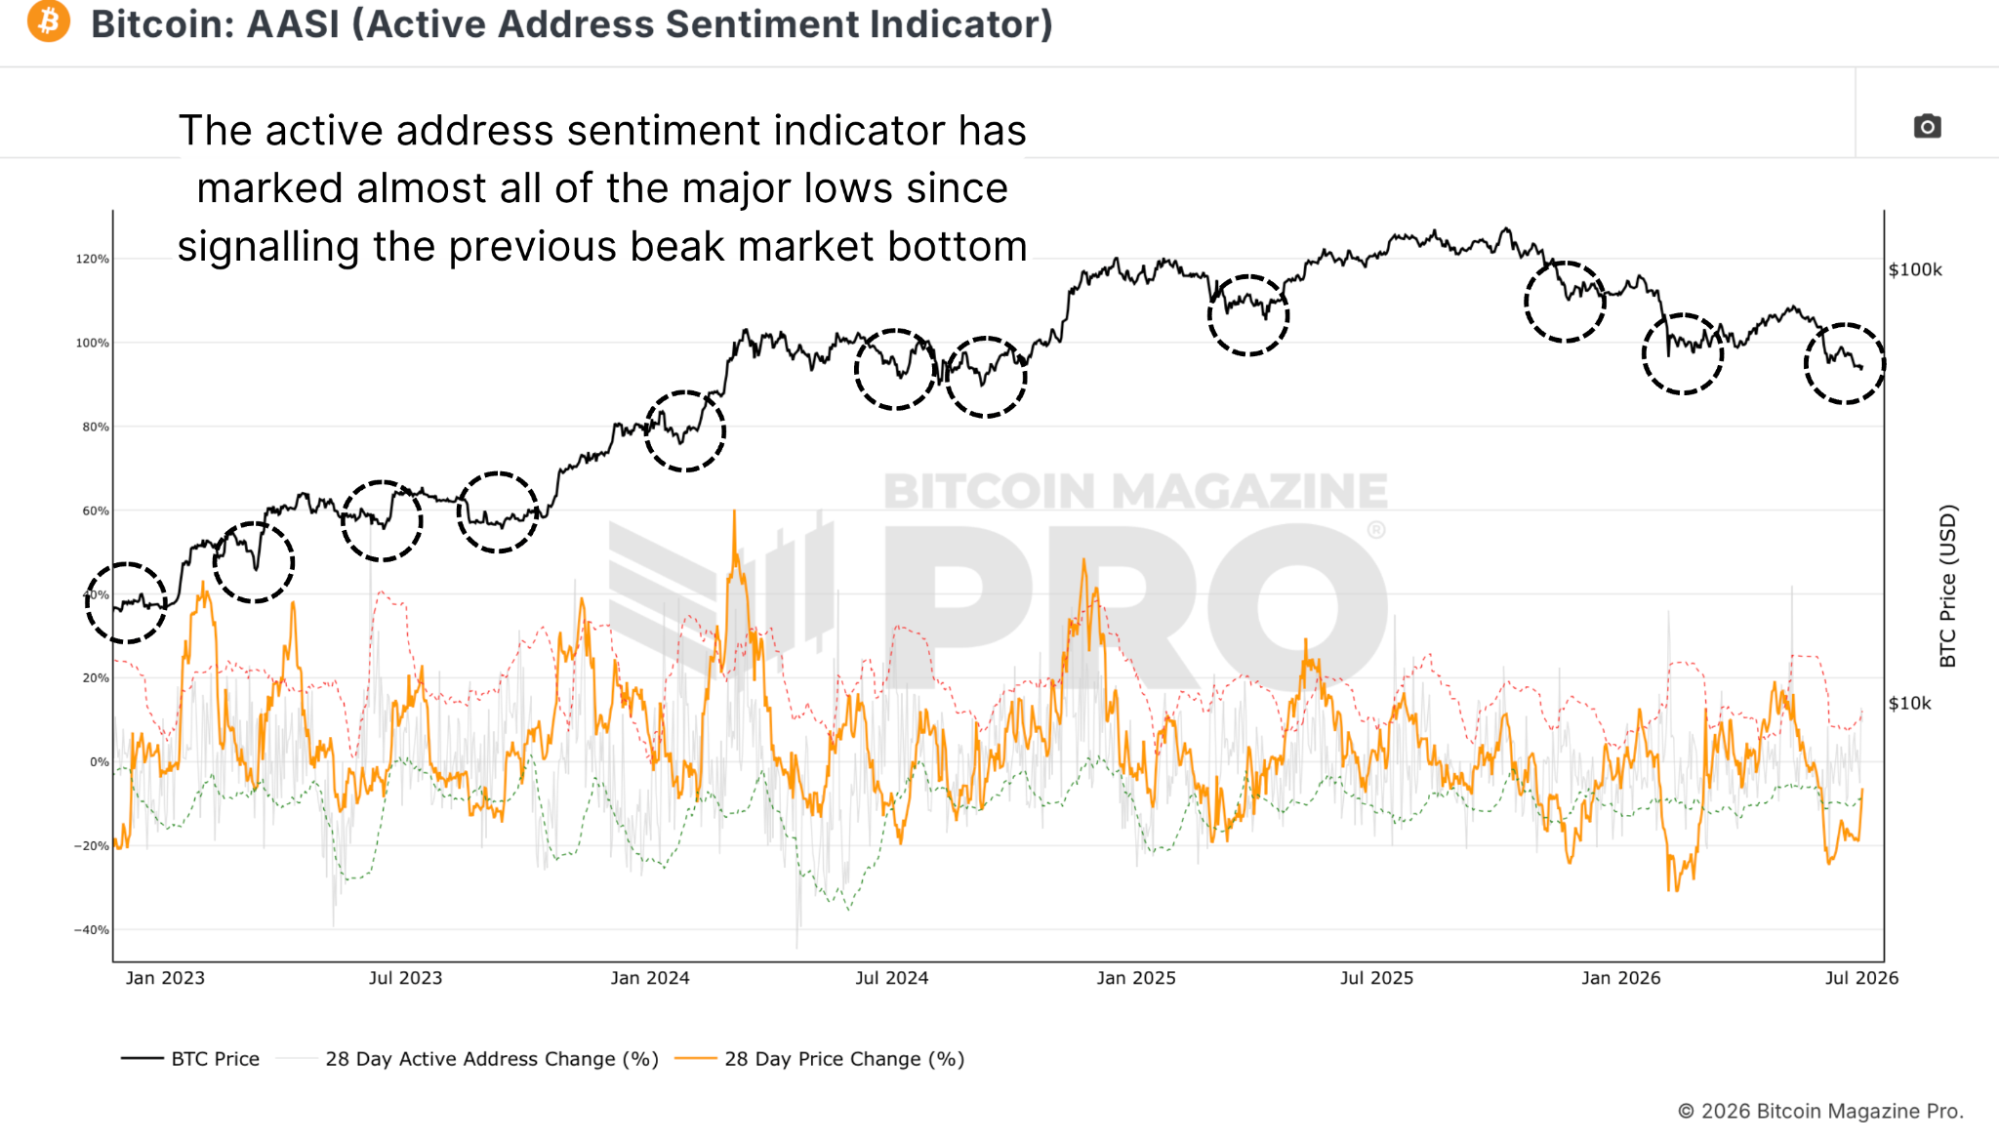
Figure 5: The Active Address Sentiment Indicator has flagged most major price lows.
Looking at every instance where this indicator has crossed back above its lower deviation band since the previous bear market low, the track record is solid. It's not flawless, and no indicator is, but on most occasions, it has marked price levels shortly before meaningful moves higher.
To Sum It Up
The weight of evidence here is broad. It's not one indicator, one timeframe, or one way of measuring. It spans momentum readings on both daily and weekly charts, historical duration fractals, moving average signals, and network utilisation. Even the relative purchasing power charts and the Bitcoin production cost angle we didn't dig into today are both showing similar tail-end situations for BTC.
Could we see a few more percent of downside? Yes. Will the bottom land in exactly 10 to 14 days? Nobody knows. I'd want to see a convincing reclaim of key resistance points above $70,000 at the very least before thinking the bull market could be back on. But to not even consider scaling in at these levels feels like the riskiest move to make right now.
Watch our most recent YouTube video here:
The Bitcoin Bottom Signal Is Less Than 2 Weeks Away
Matt Crosby (@MattCrosbyPro)
Director of Research & Analytics
La información contenida en este sitio no debe considerarse asesoramiento financiero. Por favor revise la Descargo de responsabilidad para más información.