Mastering Confluence For Superior Bitcoin Signals
2 de enero de 2026
Author: Matt - Lead Analyst
Bitcoin’s price action rarely presents perfect accumulation and distribution opportunities when viewed through a single indicator or timeframe. Many metrics, while effective for identifying cycle peaks and troughs, frequently fire signals marginally too early or too late, missing optimal exit or entry windows. A more sophisticated approach leverages confluence across multiple timeframes and metrics simultaneously, substantially improving signal accuracy and dramatically enhancing the probability of capturing extreme price movements at precisely the right moments.
One Metric Problem
The daily Bitcoin Crosby Ratio demonstrates the limitations of single-timeframe analysis. Historically, this indicator has signaled accumulated near lows (the green band) and distributed near peaks (the red band) with reasonable consistency. Yet imperfections persist. Occasionally, selling too early, accumulating prematurely on certain dips, or missing signals entirely on volatility that doesn’t meet specific threshold criteria.
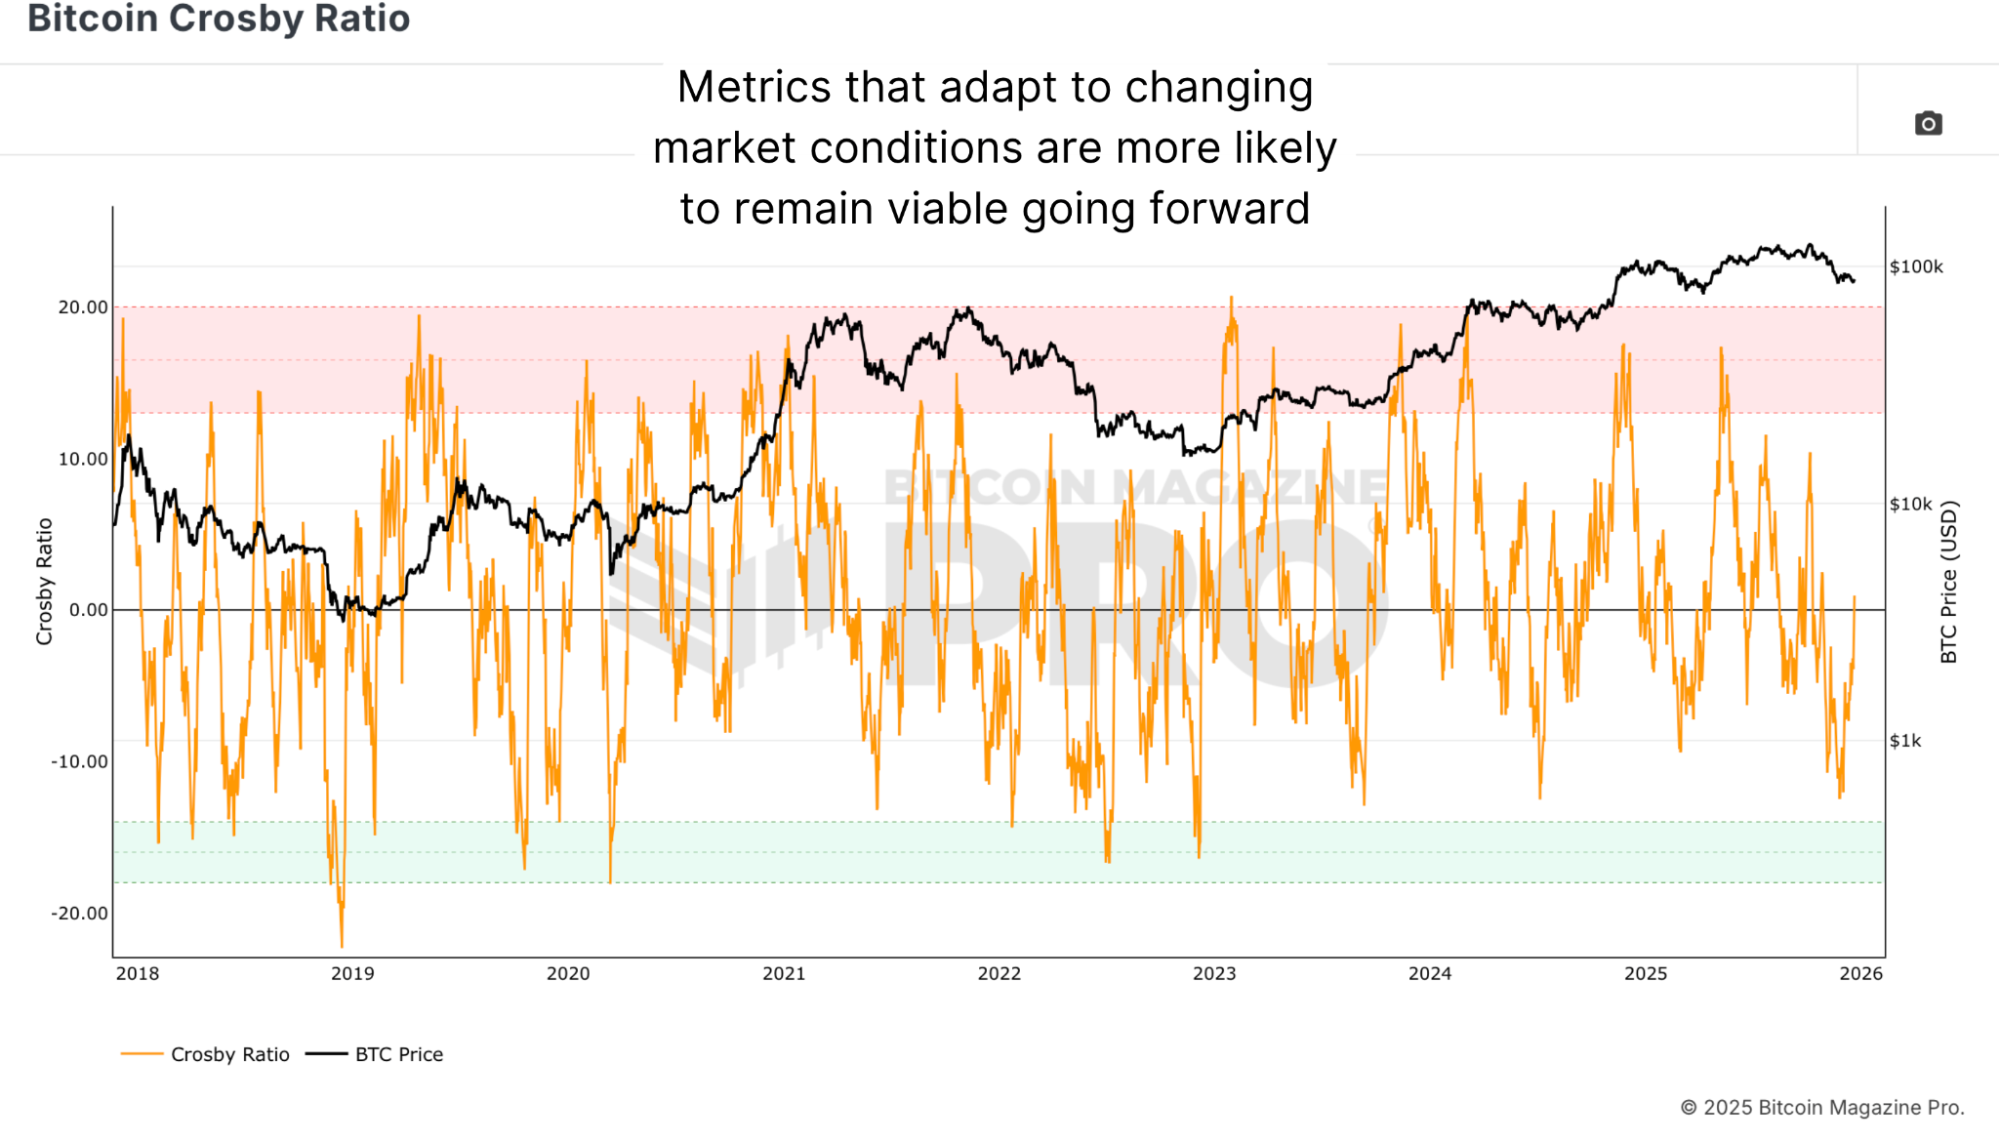
Figure 1: Despite the overall reliability of the daily Crosby Ratio, it has, on occasion, signaled at the wrong time.
The weekly timeframe presents the opposite problem. While the weekly Crosby Ratio excels at identifying macro peaks and lows, it fails to capture intra-cycle opportunities. A timeframe that fires only at cycle extremes is too coarse-grained for active investors seeking intermediate buying or even selling opportunities.
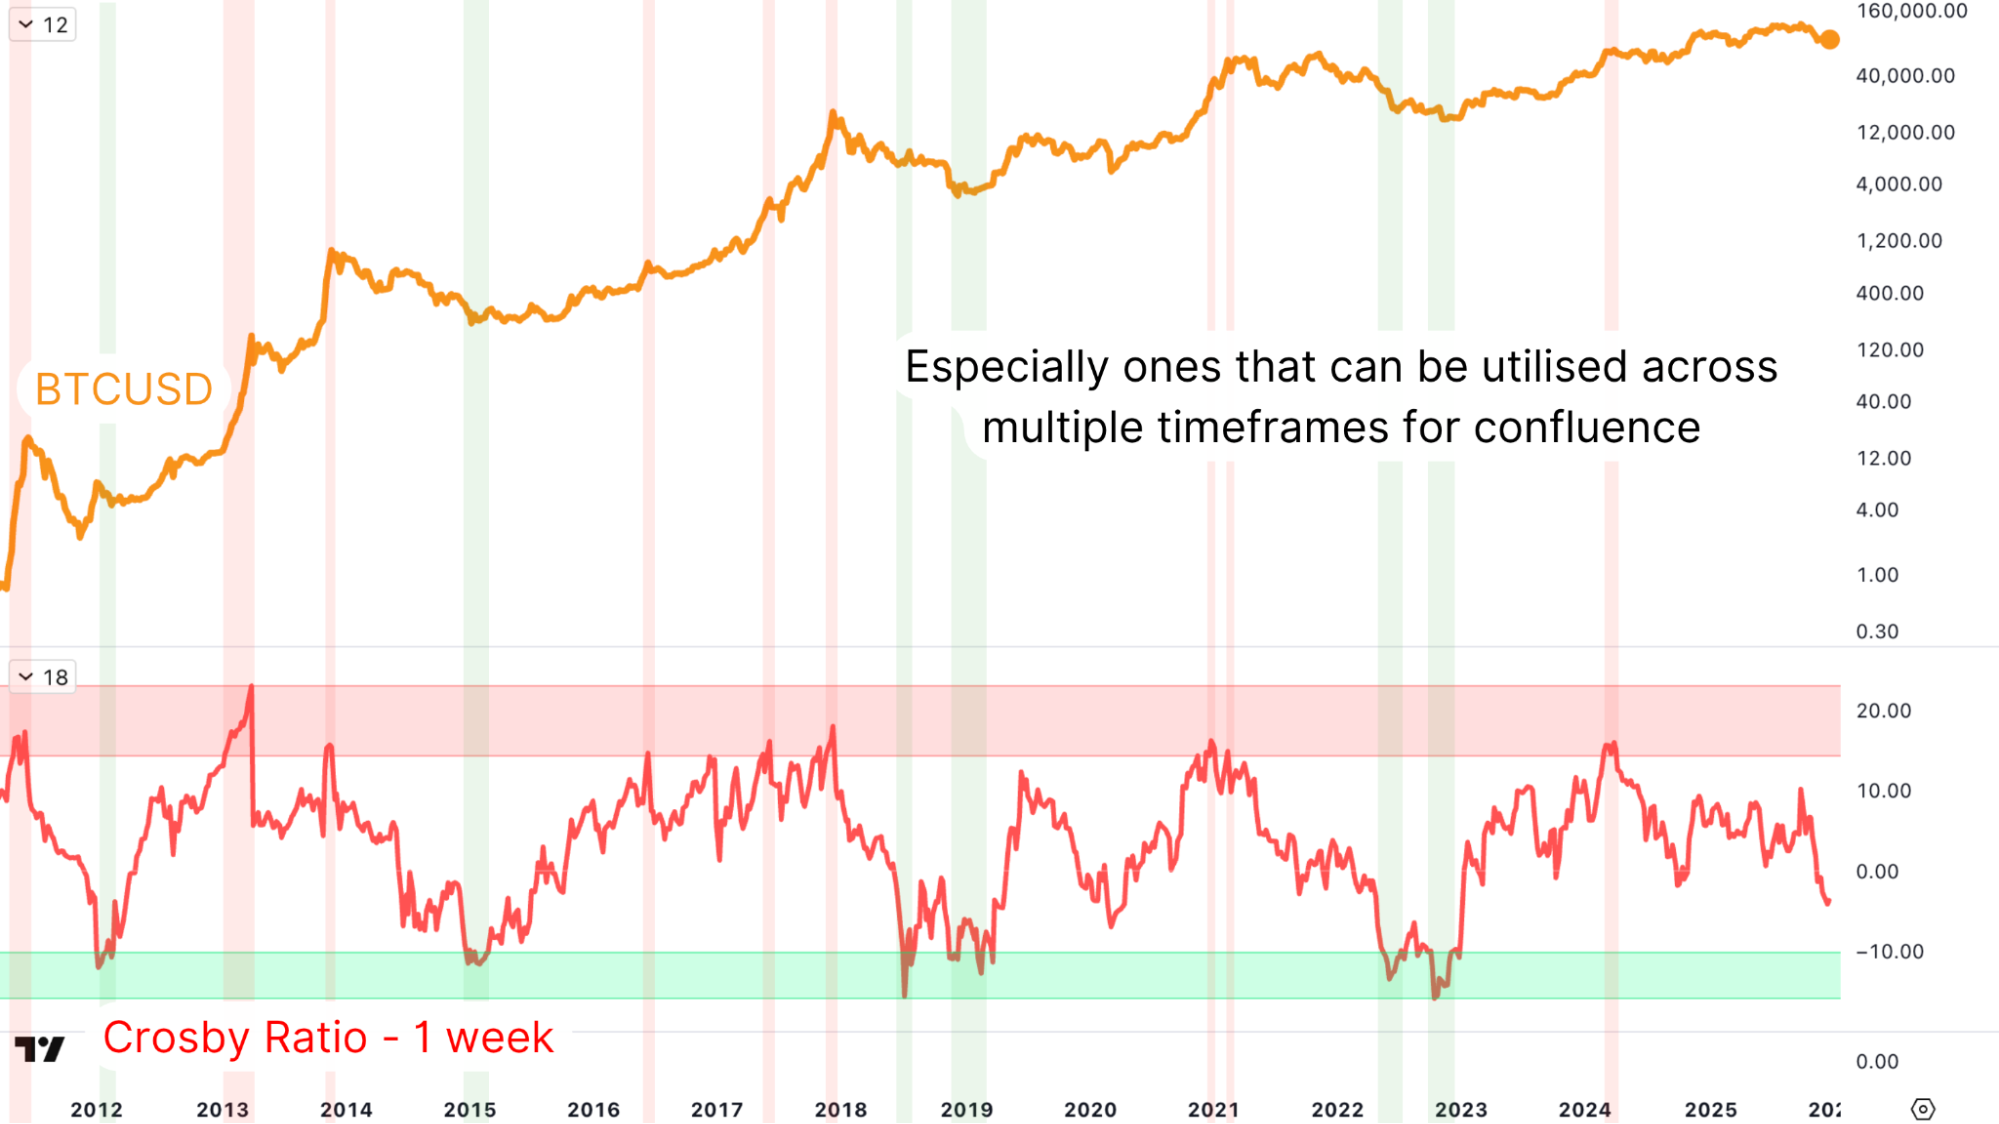
Figure 2: The Crosby Ratio, operating on a weekly timeframe.
Multi-Timeframe Confluence
Combining the 4-hour, 12-hour, and daily Crosby Ratio into a single analysis framework dramatically improves signal quality. Rather than relying on any single timeframe’s decision, confluence emerges only when multiple timeframes align in their assessment.
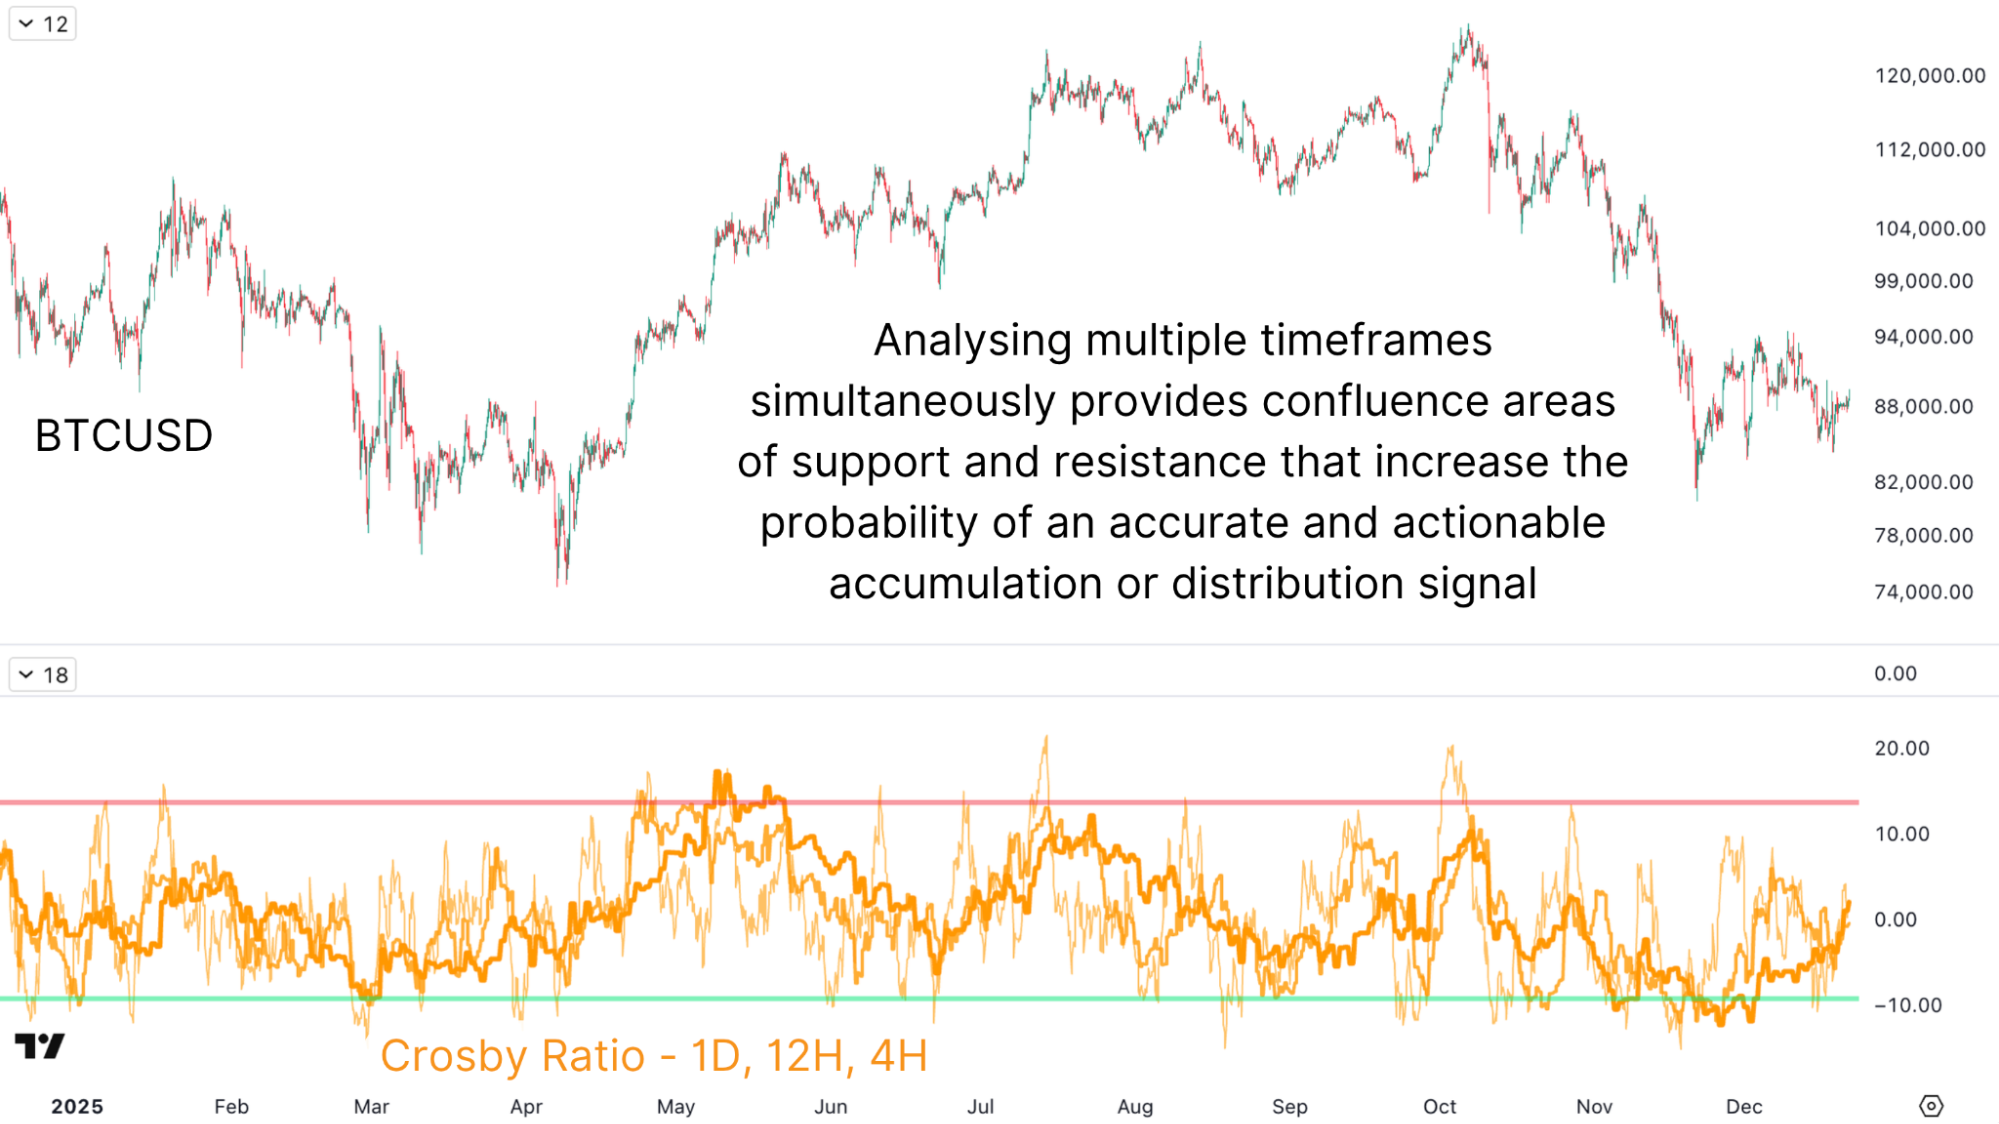
Figure 3: Combining three timeframes of the Crosby Ratio provides confluence and increases signal accuracy.
The 4-hour timeframe might suggest a local peak forming, but if the 12-hour and daily Crosby ratios haven’t reached their selling thresholds, this represents noise rather than a genuine distribution signal. Conversely, when only the daily shows accumulation potential while shorter timeframes lack confirmation, patience proves rewarded. Historically, this multi-timeframe approach has marked exact cycle lows and peaks with remarkable precision. When all three timeframes align beneath their respective oversold levels simultaneously, subsequent price action has generated strong bounces. The inverse holds true when all three timeframes align above overbought levels, distribution signals prove reliable.
Enhanced Signal Clarity
Further refinement comes from averaging the three time frame signals into a single composite metric. Rather than mentally synthesizing three separate lines (difficult to read and prone to interpretation errors), averaging produces a single line representing aggregate multi-timeframe positioning.
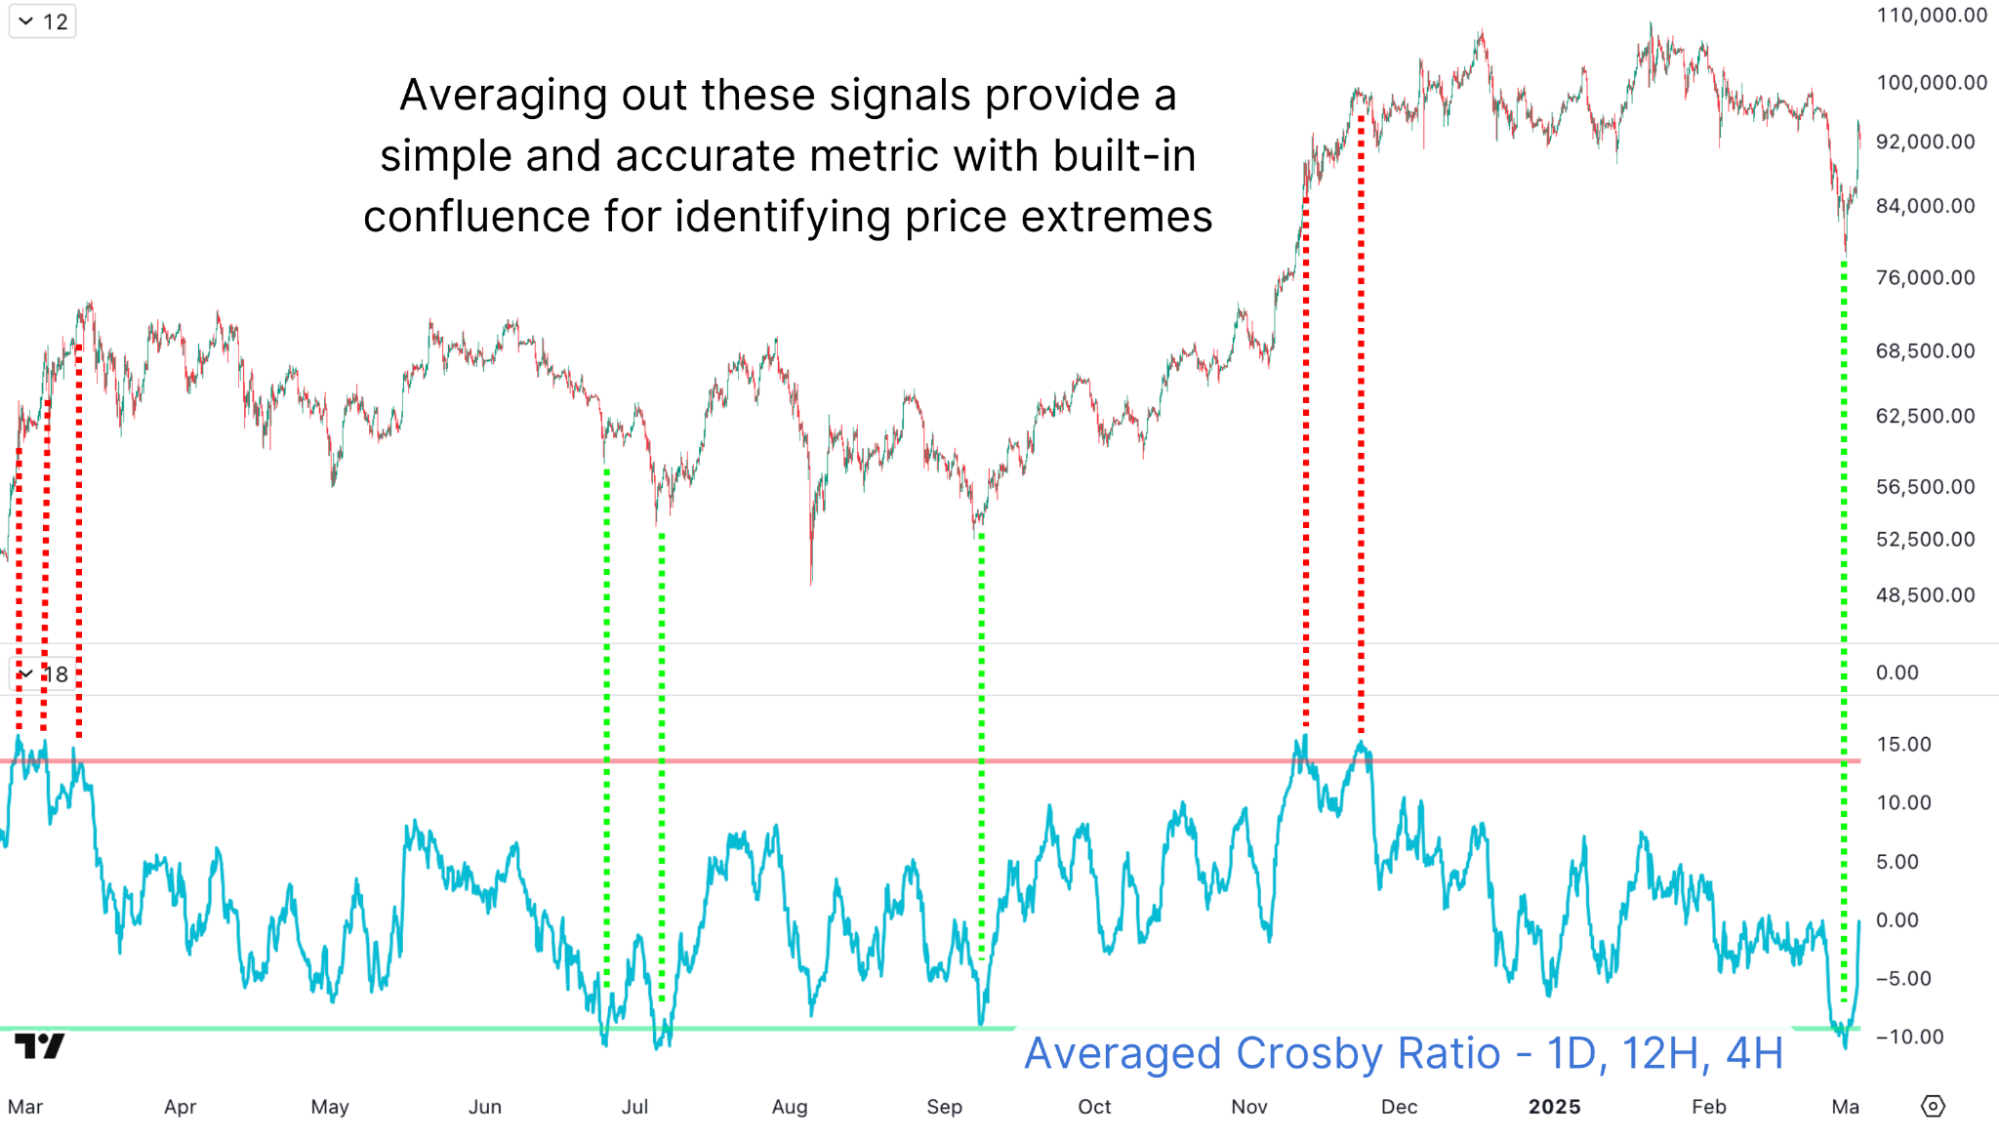
Figure 4: Combining the multi-timeframe metrics into a single averaged signal further refines this indicator.
This averaged metric has functioned nearly flawlessly throughout the current Bitcoin cycle. Where individual timeframes occasionally produce ambiguous signals, the averaged version clearly delineates accumulation and distribution windows. The smoothing effect eliminates noise while preserving the critical inflection points where directional shifts occur.
Cross-Metric Confluence
Sophistication increases further by pairing multi-timeframe analysis with additional metrics like the Retail Capital Momentum. This indicator measures changes in stablecoin dominance across cryptocurrency markets, functioning as a monetary fear-and-greed index that complements sentiment-based alternatives.
When stablecoin dominance spikes sharply downward, it indicates capital rotating out of safe-haven assets into riskier cryptocurrency plays, a contrarian signal of potential market tops. Conversely, massive spikes in stablecoin dominance indicate flight to safety, suggesting panic selling and attractive accumulation zones.
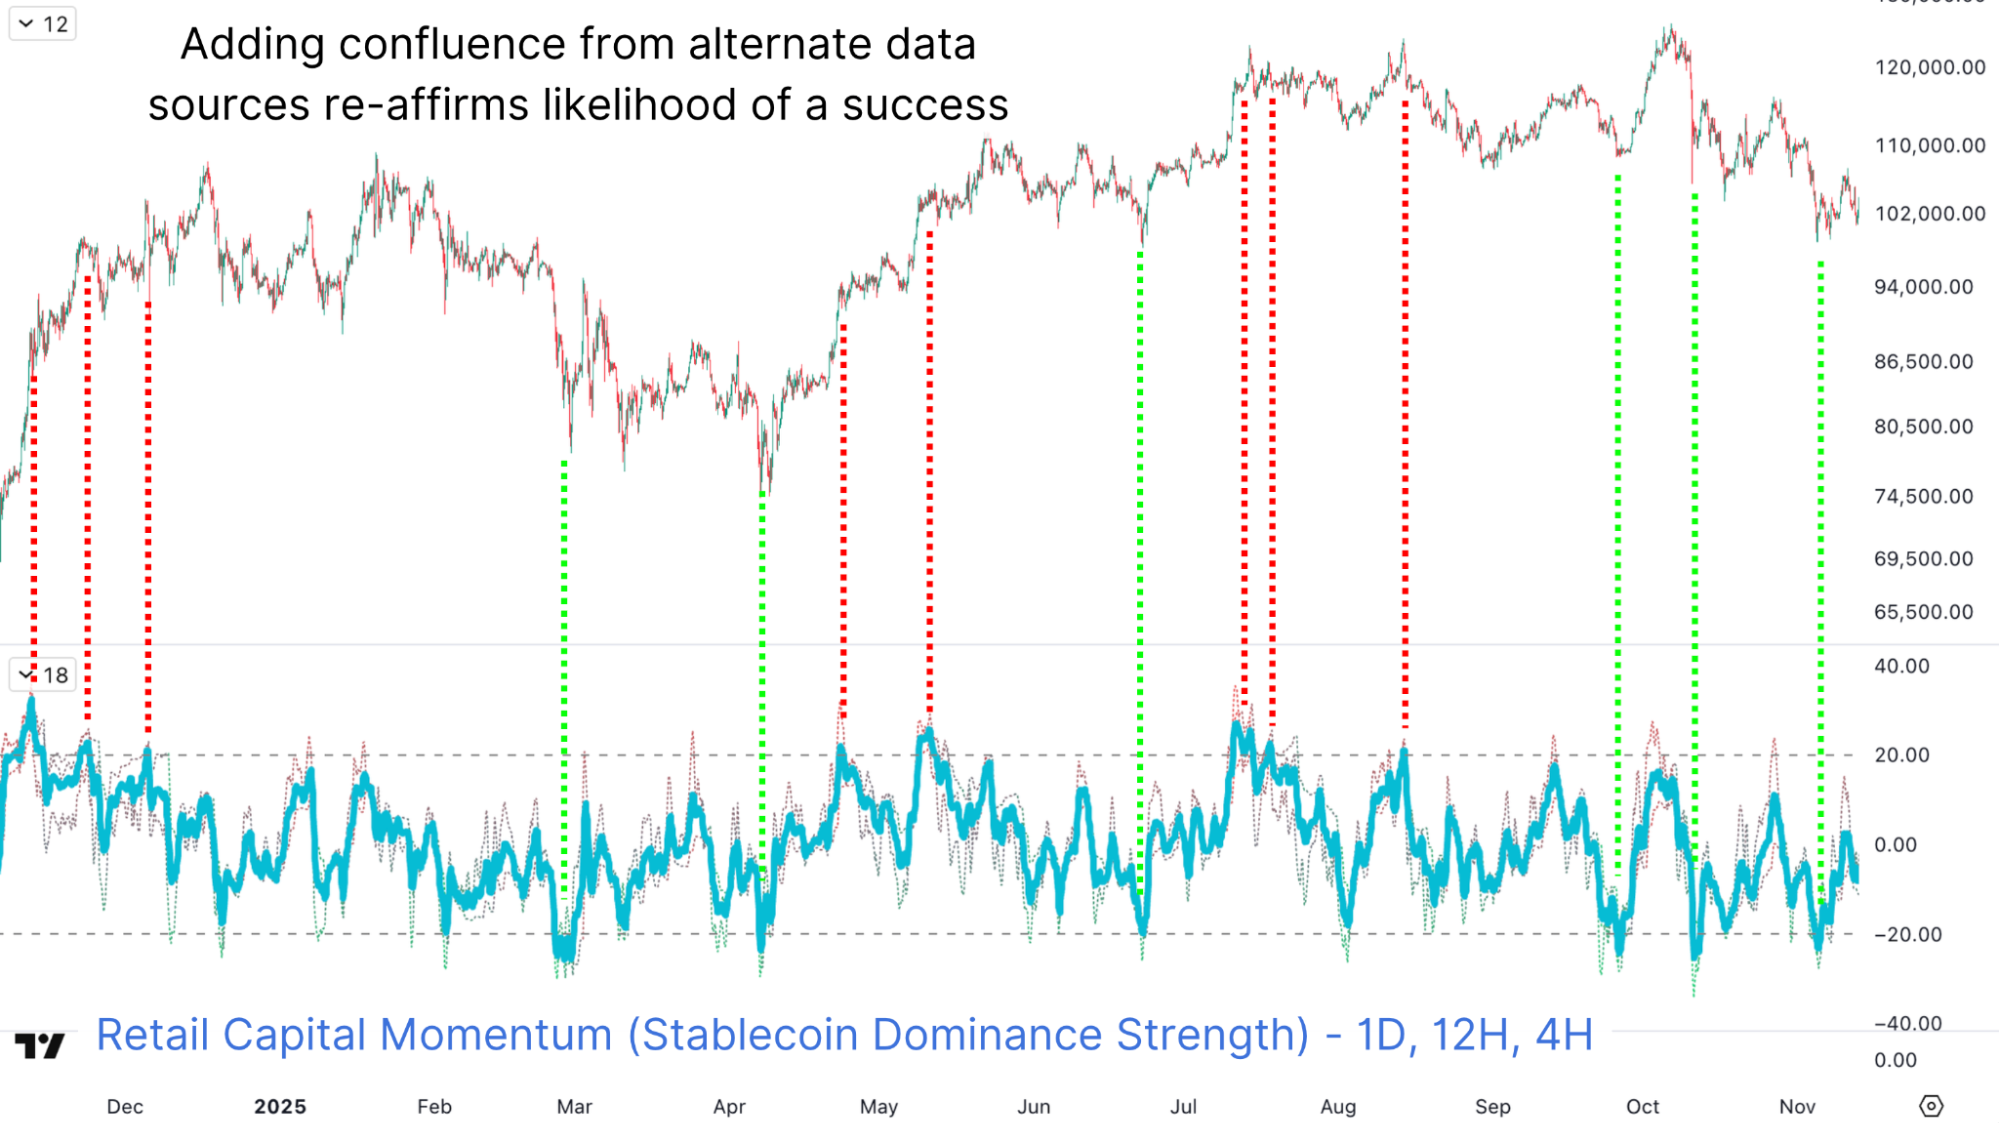
Figure 5: Pairing the multi-timeframe Crosby Ratio with an additional on-chain capital flow indicator provides further confluence.
The critical insight is that this Retail Capital Momentum indicator operates on different principles than purely price action metrics. While the Crosby Ratio analyzes angular price movement, Retail Capital Momentum monitors actual capital flows. Confluence between these independent analytical frameworks produces extraordinarily high-probability signals.
Conclusion
After years of emphasizing confluence as a critical investment principle, the practical implementation can seem tedious. Yet the specific application of multi-timeframe analysis represents a quantifiable methodology that has historically produced near-perfect entry and exit signals for Bitcoin. For traders and investors navigating Bitcoin’s volatility, the difference between single-timeframe and metric systems and multi-timeframe, multi-metric frameworks separates marginal performance from exceptional results.
For a more in-depth look into this topic, watch our most recent YouTube video here:
Bitcoin Multi-Timeframe Confluence: The Real Edge
Matt Crosby
Director of Research & Analytics - Bitcoin Magazine Pro
La información contenida en este sitio no debe considerarse asesoramiento financiero. Por favor revise la Descargo de responsabilidad para más información.