Bitcoin Is 0.27% Of Global Wealth. Here's Where The Math Points By 2030.
29 de mayo de 2026
Author: Matt - Director of Research & Analytics
If you want to understand Bitcoin's true trajectory, stop measuring it against the US dollar. The dollar loses purchasing power every year, which means anything with even a modestly fixed supply looks like it's gaining ground against it. The more useful question is: how is Bitcoin doing against everything else? Against real assets, against global capital, against the full pool of wealth that investors actually allocate across?
If you’re in a hurry:
- Bitcoin's returns since 2019 were approximately 2,275% in USD terms, but only around 1,372% when measured against global M2.
- The median US house price has fallen from roughly 1,300 BTC in 2015 to around 5 BTC today.
- Bitcoin barely exceeded its 2021 all-time high in gold terms during the most recent cycle.
- Bitcoin currently represents approximately 0.27% of all global capital, just over a quarter of one percent of an estimated $557 trillion pool.
- Based on Bitcoin's historic trajectory, linear regression points toward a price in the region of $420,000 by the end of 2030.
USD Returns
Fiat currencies are consistently losing purchasing power. When you measure Bitcoin's gains against the US dollar, you're measuring against something that declines every year by design. A fixed-supply asset measured against an inflationary currency will always look like it's gaining ground, even if its real comparative strength is stagnating.
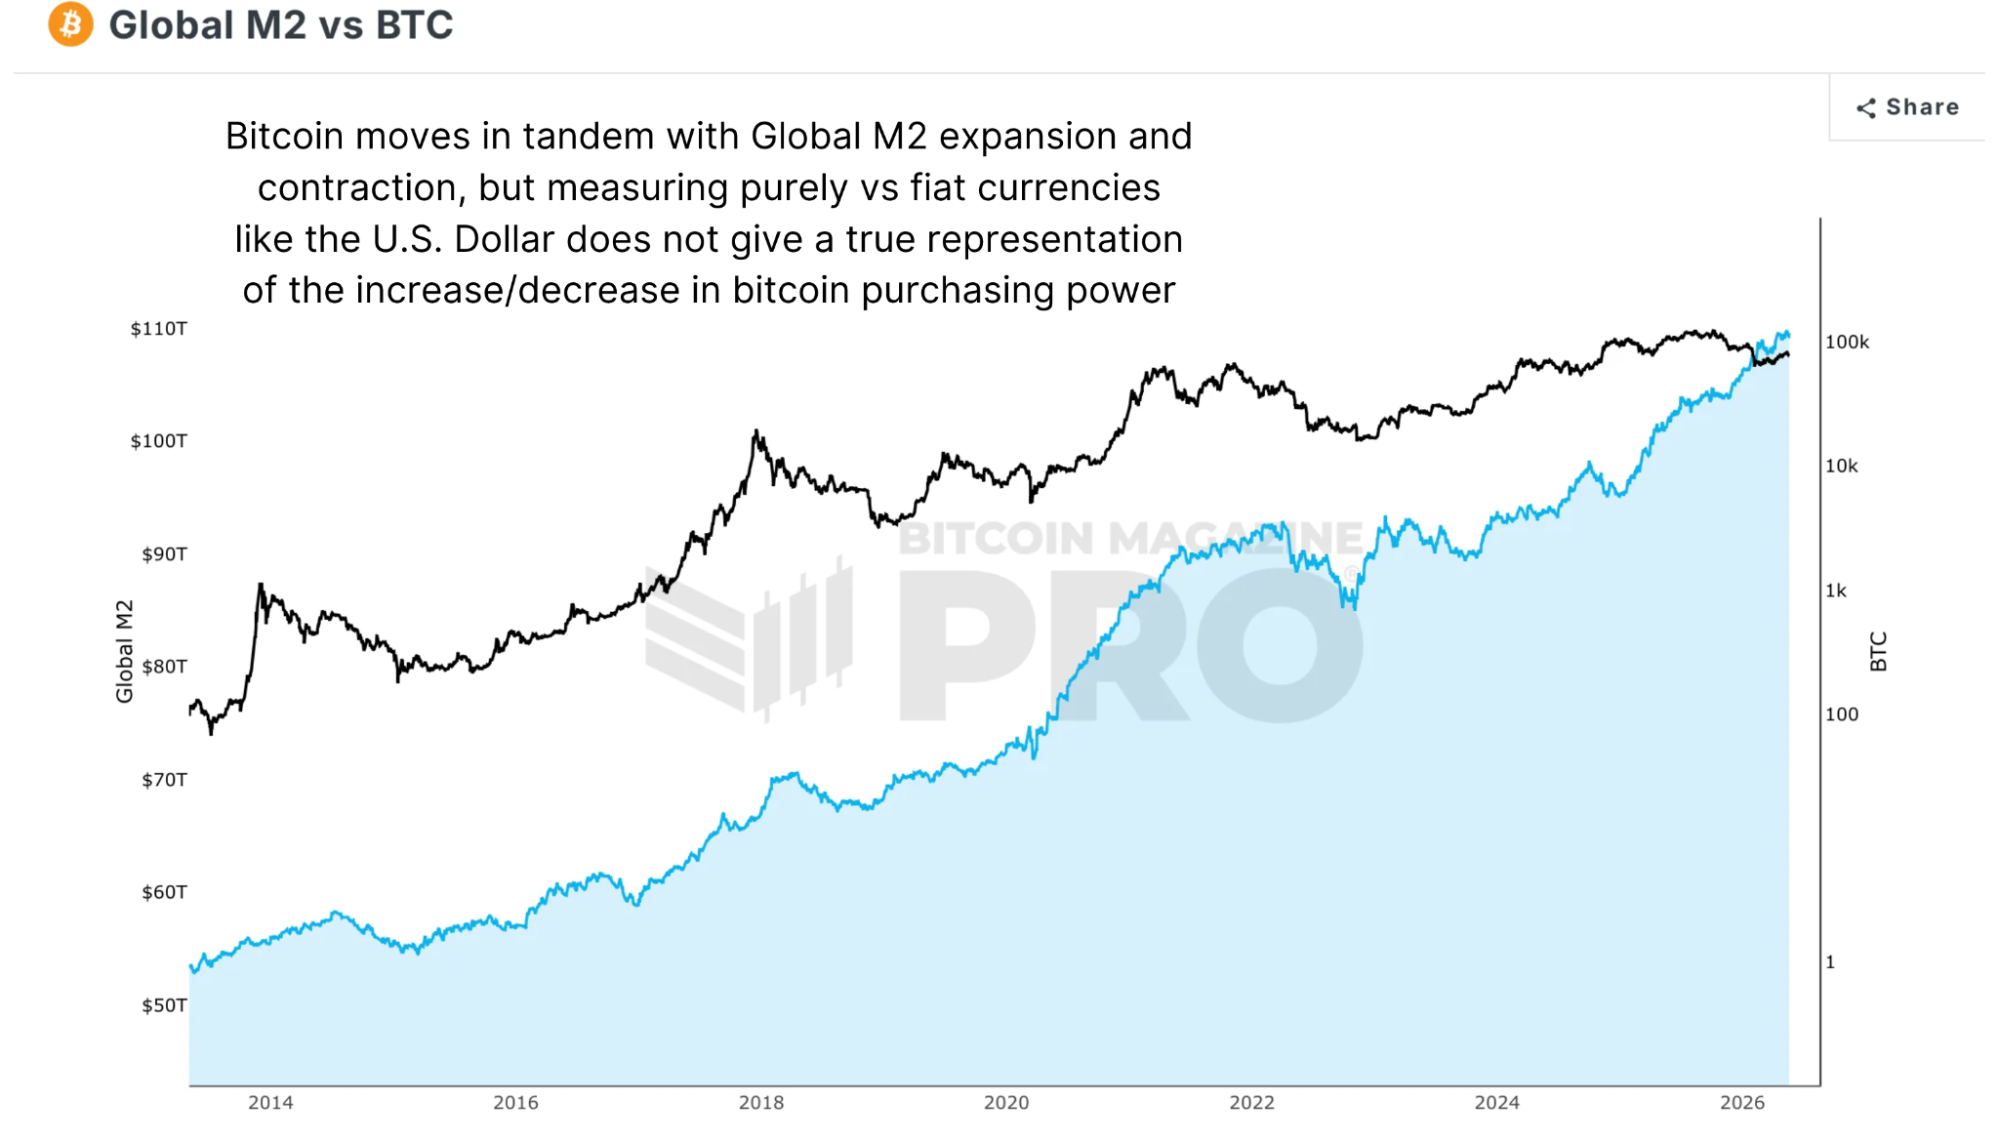
Figure 1: The relationship between Bitcoin price and Global M2 is evident.
Global M2, the broadest measure of money circulating in the global economy, gives a better baseline. When Bitcoin's returns are measured against global M2 rather than raw USD, the numbers shift considerably. Since the 2019 bear market low, USD-denominated returns were approximately 2,275%. Against global M2, that figure was closer to 1,372%. Still extraordinary, but nearly 900 percentage points lower. That gap represents the silent effect of currency debasement flattering nominal performance figures.
Assets
One of the cleaner ways to see Bitcoin's genuine purchasing power trajectory is to price real assets in Bitcoin rather than dollars. The median US house price, expressed in bitcoin, has fallen from roughly 1,300 BTC in 2015 to approximately 5 BTC today. Through every bear market, every cycle, every period of drawdown, the trend has been consistent: it takes progressively less bitcoin to buy the same real asset. That's what genuine appreciation in purchasing power looks like.
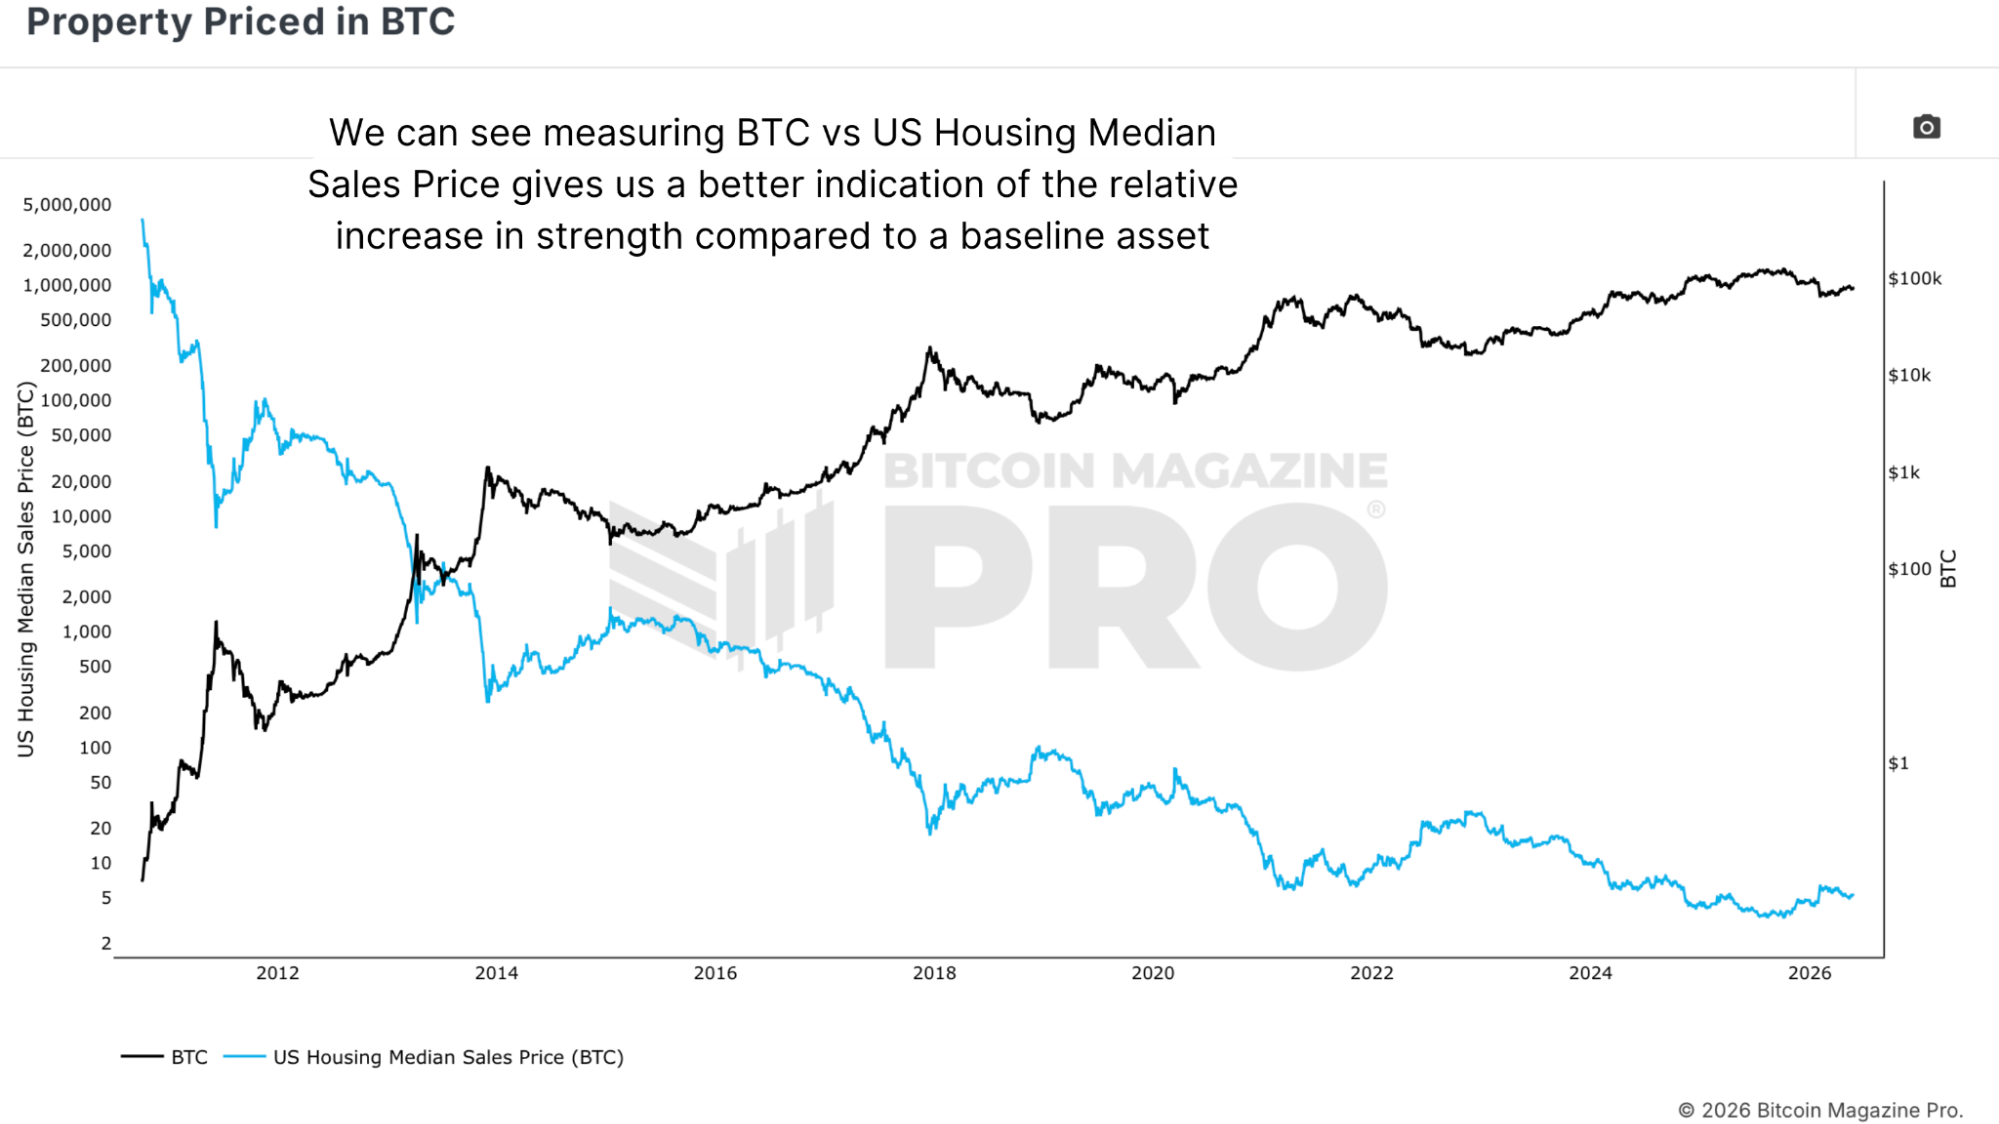
Figure 2: Expressing the US Housing Median Sales Price in BTC.
The more difficult picture is Bitcoin's recent performance against financial assets. Against gold, Bitcoin barely broke above its 2021 cycle high in the most recent bull market, a high the narrative suggested should have been comfortably surpassed given everything that had changed institutionally. When the drawdown came, the decline in Bitcoin relative to gold exceeded 70%, despite the USD chart showing only around a 52% drop. That divergence explains why the cycle felt more brutal than the headline numbers suggested.
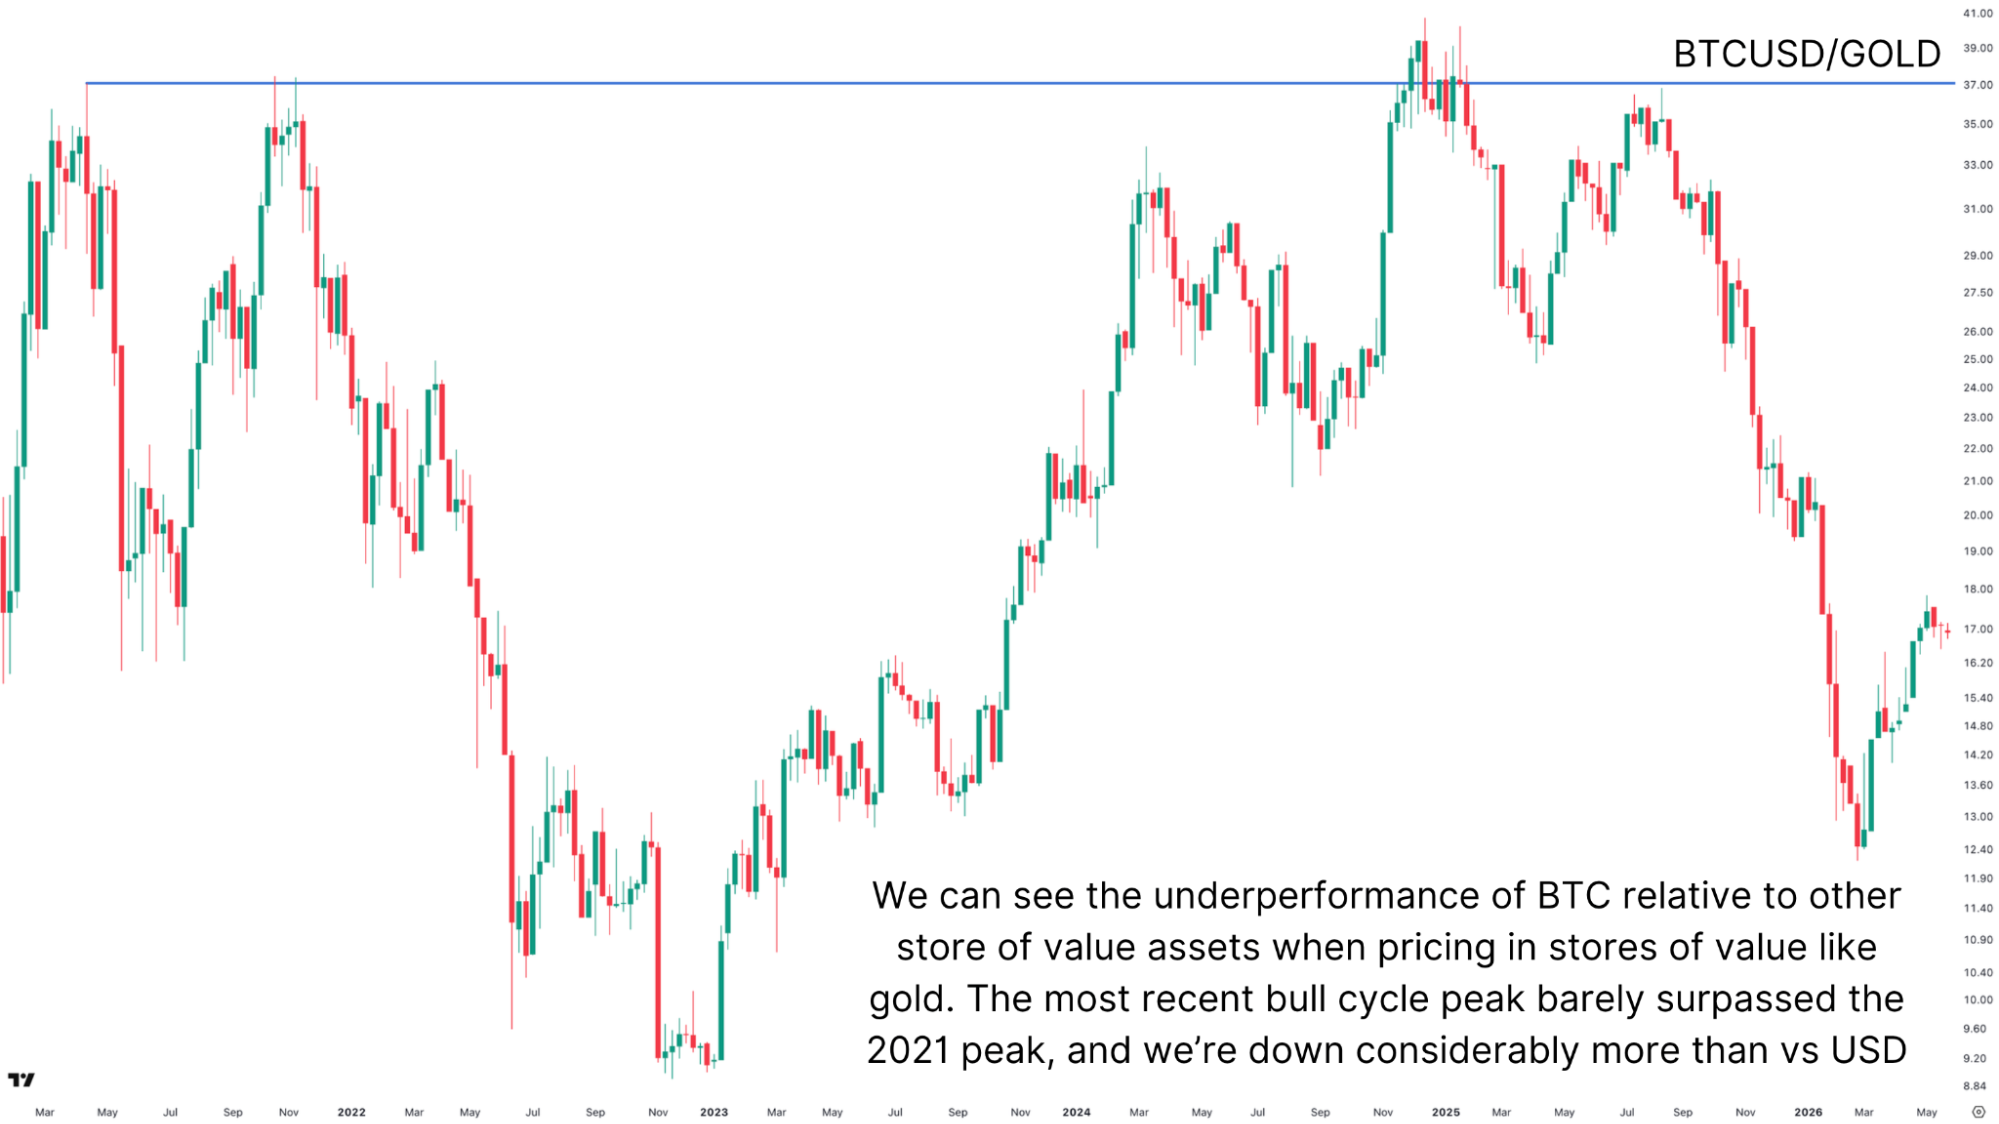
Figure 3: Relative to gold, BTC has significantly underperformed during recent cycles.
Global Wealth
Bitcoin currently represents approximately 0.27% of total global capital, just over a quarter of one percent of an estimated $557 trillion in investable wealth across equities, bonds, real estate, gold, M2, private markets, pension assets, forex reserves, sovereign wealth funds, and other assets.
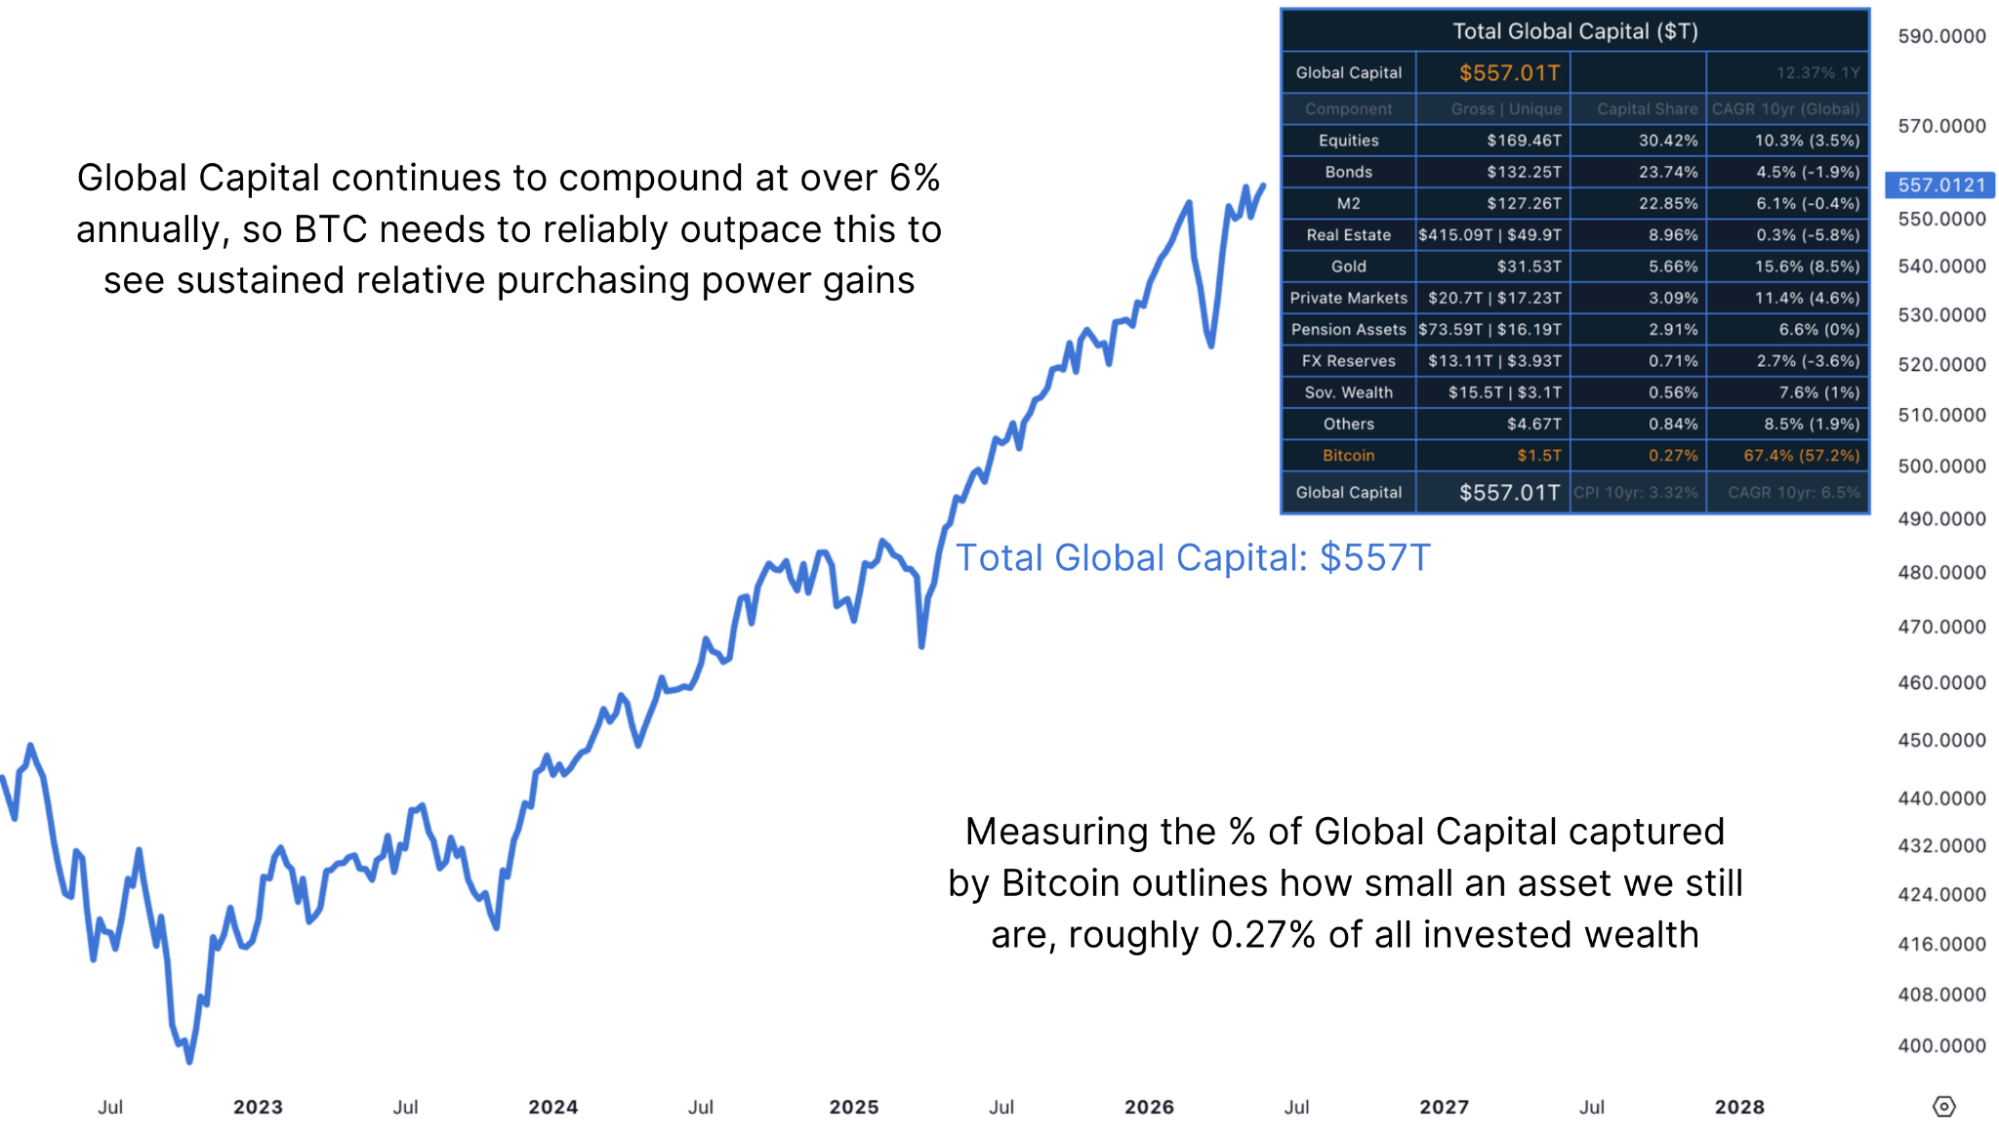
Figure 4: Breaking down Global Capital into its key components reveals that BTC currently contributes only about 0.25%.
For context, gold increased its market cap by approximately $20 trillion in two years. That's more than ten times Bitcoin's entire current market cap, achieved by a single commodity in a relatively short period. Silver went from a market cap close to Bitcoin's to around $7 trillion, roughly a 4x, in about a year. Bitcoin reaching even 1% of global wealth from its current position would represent a substantial reallocation of capital, but the precedent for assets doing exactly that kind of thing exists in plain sight.
2030 Projection
If you map Bitcoin's historic trajectory as a share of global wealth using a linear regression, the data points toward Bitcoin crossing 1% of global capital around mid-2030. At the end of 2030, the projection sits at approximately 1.15% of global wealth.
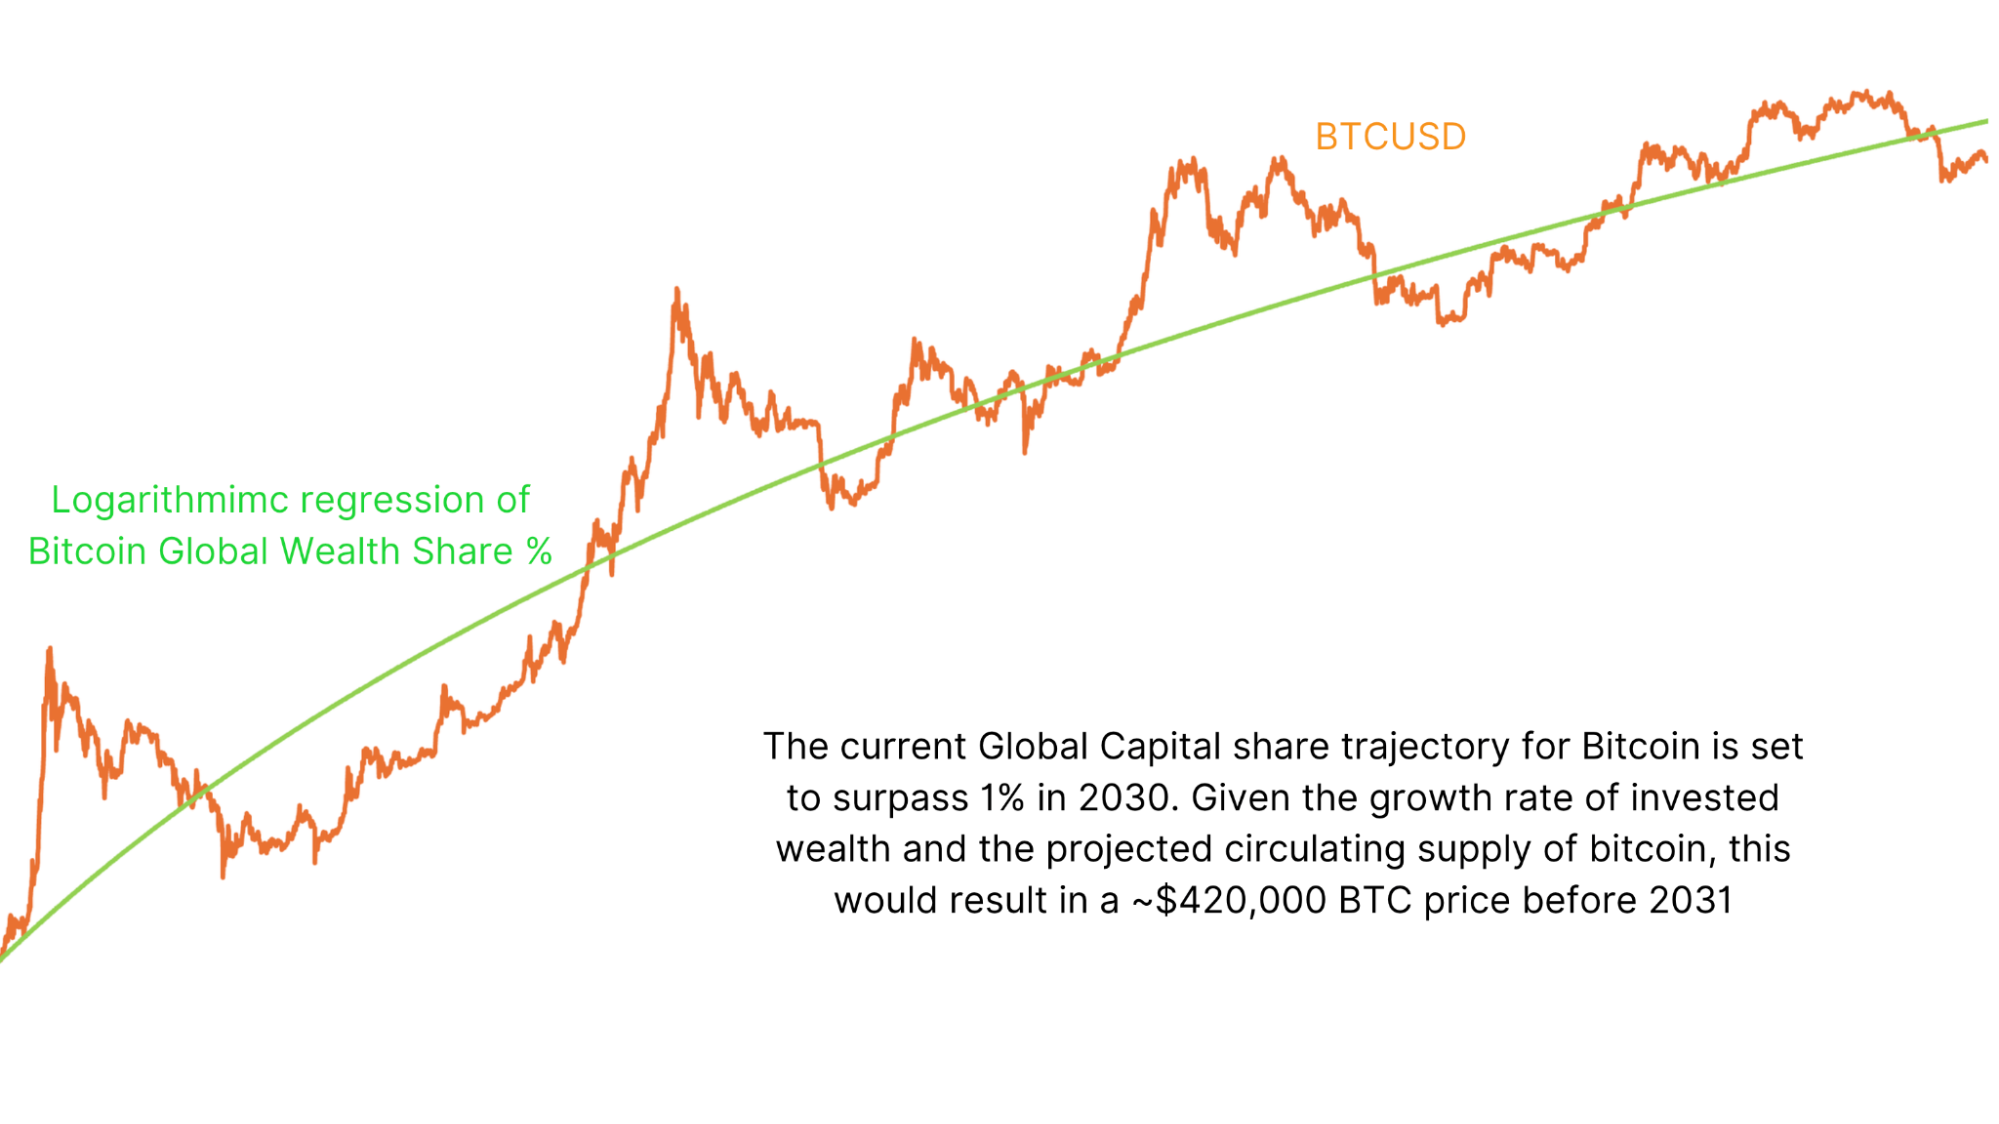
Figure 5: Extrapolating the future expansion of global wealth and the potential implications for BTC’s share and value.
Global capital isn't static. Applying the 10-year compounded annual growth rate of global wealth, approximately 6.66%, the total pool of investable capital is projected to be in the region of $747 trillion by the end of 2030. Bitcoin at 1.15% of that figure represents a market cap of approximately $8.6 trillion. Divided across the projected circulating supply of around 20.56 million BTC at that point in time, that implies a Bitcoin price in the region of $420,000.
Bringing It All Together
The last few years have been underwhelming for sure, and it's worth being honest about that rather than papering over it with nominal dollar gains. Bitcoin needs to gain genuine relative strength against other assets, not just appreciate against a debasing currency, fulfilling the thesis most long-term holders are operating on.
But the structural case remains intact. 0.27% of global wealth, in an asset with a fixed supply, falling inflationary rate, and accelerating institutional adoption, still represents one of the more asymmetric setups in financial markets. The math of getting from here to 1%, and what that implies for price, is the most worthwhile framing of what the long-term opportunity actually looks like.
And watch our most recent YouTube video here:
Bitcoin Is Only 0.27% Of Global Capital — I Know That Changes Before 2030
Matt Crosby (@MattCrosbyPro)
Director of Research & Analytics
La información contenida en este sitio no debe considerarse asesoramiento financiero. Por favor revise la Descargo de responsabilidad para más información.